MSCI: The Index Empire That Powers Global Finance
I. The Toll Booth on Global Capital
In November 2007, with mortgage losses already seeping through the balance sheets of every large bank on Wall Street, Morgan Stanley sold shares in a corner of its business most of its own traders rarely thought about. The unit made no loans, ran no trading book and owned no factories. It calculated numbers: the daily level of a few thousand stock-market indexes that told pension funds in Ohio, insurers in Zurich and sovereign funds in the Gulf how "the world" had performed that day. The shares were priced at $18 each.1 Within eighteen months the parent would be gone from the register entirely, and the little unit would be on its way to becoming one of the most profitable companies in the S&P 500.
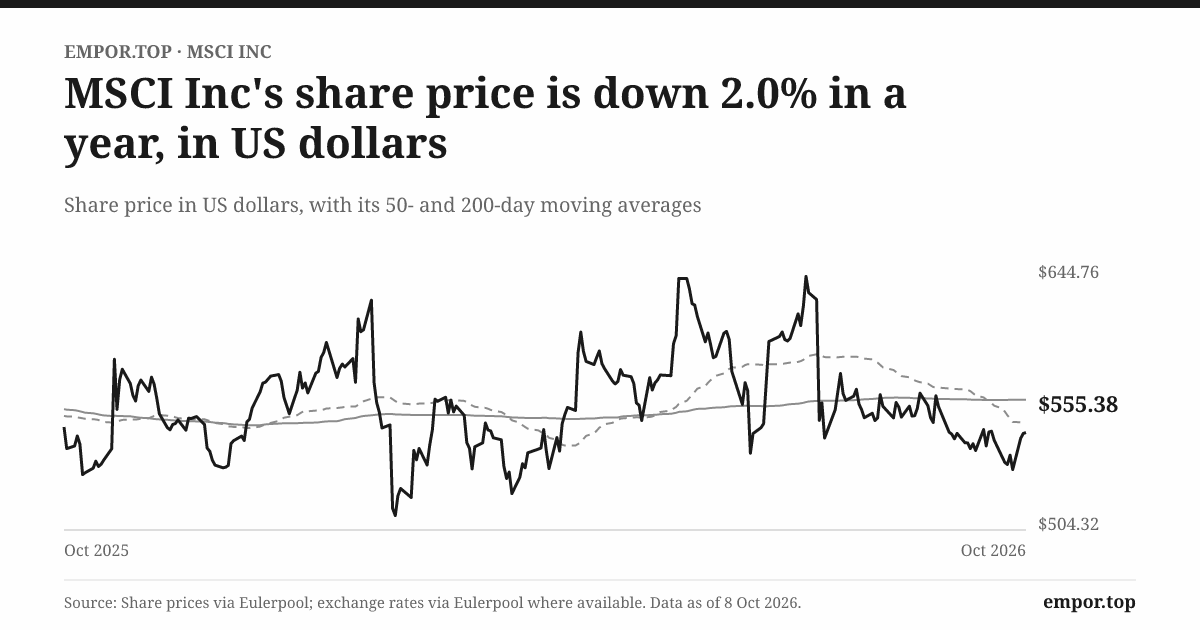
That company is MSCI Inc. Today about $16.5 trillion of institutional money is benchmarked against its indexes, which is more than the annual output of every economy on Earth except the United States and China.2 It employed 6,268 people at the end of 2025, served roughly 6,800 clients in more than 100 countries, and turned about $3.1 billion of revenue into an operating profit margin of almost 55%.2 On the morning of 8 October 2026 the market valued the whole enterprise, debt included, at about $47 billion.
Hold those two facts side by side and the paradox appears. A company with no balance-sheet risk, no inventory and a headcount smaller than a mid-sized hospital system is worth more than many of the banks it serves. The explanation is that MSCI does not really sell data. It sells a definition. When a trustee writes "our international equity manager will be measured against the MSCI EAFE Index," the trustee has signed up for a ruler, and every fund manager, consultant, ETF sponsor and derivatives desk downstream has to rent the same ruler to be judged by it. MSCI's real customer is institutional inertia: the career-protecting instinct to measure the way everyone else measures.
The model has a second, quieter engine. Roughly a quarter of group revenue comes from fees charged as a sliver of the assets sitting in ETFs and funds that track MSCI indexes.2 That money grows when markets rise and when investors shift from active to passive funds, and it shrinks when markets fall. One client, BlackRock, accounted for 10.8% of MSCI's revenue in 2025, almost all of it from those asset-linked fees on iShares products.2 So the question at the heart of this story is not whether MSCI is a great business. It plainly is. The question is how much of its famous 11% to 13% annual growth comes from structural pricing power, and how much comes from riding the equity market and its biggest customer.
There is a third thread, and it runs through the balance sheet. Over the past decade MSCI borrowed heavily to buy back its own stock, so heavily that shareholders' equity now sits at about negative $2.7 billion.2 That is not distress. It is a choice, and it raises its own question: whether a company that has squeezed most of the margin it can from its operations has started to lean on financial leverage to keep earnings per share compounding.
The road to that question runs through a Geneva-based research shop that drew the first map of world stock markets, a Wall Street bank that never quite knew what to do with it, two acquisitions that bolted risk software onto the index franchise, a bruising defection by Vanguard, a geopolitical fight over Chinese stocks, and an expensive bet on private markets. It begins in 1969, when nobody could agree on what a foreign stock market even looked like.
 Subscribe on LinkedIn
II. Inventing the Global Map: Capital International to Morgan Stanley (1969–1986)
At the end of the 1960s an American pension fund that wanted to own European or Japanese shares faced a problem that sounds absurd now. There was no common yardstick. Each country published its own local index, built by its own rules, quoted in its own currency, often weighted in ways that made comparison impossible. Exchange controls still bound most currencies under the Bretton Woods system, Japanese companies held large blocks of each other's shares, and some markets were open to foreigners only on paper. A manager who claimed to have "beaten the international market" could not prove it, because no such market existed as a number.
Capital International, the overseas research arm of the Los Angeles investment firm Capital Group, decided to build that number. Working largely out of Geneva, its analysts began publishing global equity indexes in 1969, including the benchmark that would become the industry's anchor: EAFE, short for Europe, Australasia and the Far East.1 The intellectual feat was not the arithmetic. It was the set of judgment calls hidden inside it. Which companies counted as investable? How should a Swiss franc and a yen be converted into one comparable figure? How should a company listed in two places be counted once? Each answer was a small act of standard-setting, and once published, it became the default answer for everyone who used the index.
That is the deep lesson of the origin. The first credible index in a market does not just win share. It sets the coordinates. When a later generation argued over whether Korea was "developed" or "emerging," or whether Chinese domestic shares belonged in a global portfolio, they were arguing inside a map that Capital International had started drawing decades earlier. The company that owns the map gets to decide where the borders go.
For more than fifteen years the indexes were a prestige product rather than a business. They helped Capital Group's own investment process and gave its research a global reputation. The commercial turn came in 1986, when Morgan Stanley licensed the indexes and began co-branding them as Morgan Stanley Capital International, the name whose initials the company still carries.1
Why would an investment bank want an index? Not, at first, for royalties. Morgan Stanley was building a global equities franchise just as cross-border investing was taking off in the 1980s. A widely used benchmark gave its research credibility with institutions, gave its trading desks a reason to be the first call when a client rebalanced toward "the world," and gave its sales force a product that sat on every international fund manager's screen. The index was a calling card for the bank's real businesses.
Something else was happening that the bank did not fully price. Pension consultants, the gatekeepers who advise big retirement funds, began writing EAFE into investment policy statements. Once a trustee's contract said a manager would be judged against EAFE, the manager had to buy EAFE data, construct portfolios with EAFE in mind, and report against EAFE every quarter. The consultant who recommended the next manager compared candidates on the same basis. Each new user made the benchmark more valuable to the next one, which is the textbook definition of a network effect, and it was compounding quietly inside a bank that saw the index as marketing.
By the mid-1980s, then, the essential asset already existed: a ruler that the institutional world had agreed to measure itself with. What it did not yet have was an owner who treated it as the main event rather than a sideshow, or a defense against the rivals who would soon notice how valuable a ruler could be.
III. The Incubator and the Float Revolution (1986–2004)
Henry Fernandez did not look like the man who would turn a back-office data shop into a $40 billion company. Born in Nicaragua, he had come to the United States, studied at Stanford Business School and joined Morgan Stanley in 1983, working his way through corporate finance and emerging-markets roles before he was handed the index unit in the mid-1990s and became its chief executive in 1998.3 Colleagues have described him as intense, intellectual and unusually patient, a banker who preferred building franchises to closing deals. The unit he took over was profitable, small and awkwardly placed.
The awkwardness was a conflict of interest that grew harder to ignore as the indexes grew more important. MSCI decided which countries were "emerging," which companies entered its flagship benchmarks and how heavily each was weighted. Every one of those decisions moved money. And it was all happening inside an investment bank whose analysts covered the same companies, whose bankers sold them stock, and whose traders profited from the flows that index changes created. Clients could reasonably ask whether a methodology change was neutral or convenient. The franchise survived on trust, and trust is hard to sustain when your parent is on the other side of the trade.
At the same time, competition arrived. FTSE in London and Dow Jones in New York built global index families and began courting the same pension funds and asset managers, while Standard & Poor's dominated the American market.4 An index war is a strange kind of war, because the incumbent rarely loses customers outright. It loses the next mandate, the next new fund, the next consultant's recommendation. For a business whose value rested on being the default, a slow drift toward rivals would have been fatal.
The weak point rivals could attack was a flaw everyone in the industry knew about. Early indexes weighted companies by their total market value, counting every share whether or not an investor could buy it. In practice, that meant state-owned enterprises whose shares sat with governments, and Japanese companies whose stock was locked up in cross-shareholdings among banks and business partners, were weighted as if those shares traded freely. An index fund trying to copy the benchmark would have to buy shares that barely existed in the market, pushing up their price and distorting the very thing it was measuring.
The fix was free-float weighting: counting only the shares genuinely available to investors. It sounds like a technicality. It was a revolution, because it reshuffled country and company weights across the globe and forced every manager benchmarked to MSCI to trade in response. MSCI announced the shift and phased it in between 2001 and 2002.1 Clients complained about the cost and disruption, and the company accepted that pain rather than let a rival present itself as the more accurate ruler. In doing so it disrupted its own product before anyone else could.
That decision deserves more credit than it usually receives. Standards rarely fall to a better competitor in a single blow. They fall when the incumbent defends an obvious flaw because fixing it is inconvenient. By moving first, MSCI made its methodology the reference version of the very improvement that could have been used against it, and the episode set a pattern it would repeat for decades: methodology changes announced well in advance, opened to client consultation, and then imposed on the whole market at once.
By the early 2000s Fernandez had also absorbed the economics that would shape everything after. An index costs a great deal to build and maintain, because someone has to track every dividend, spin-off, share issue and corporate action across dozens of countries. But delivering the result to one more client costs almost nothing. High fixed costs and near-zero marginal costs make a natural monopoly, or at least a natural oligopoly, and they reward whoever has the most users. The question was how to make each user more deeply dependent on MSCI, and the answer would come from a firm in Berkeley.
IV. Risk as a Second Toll: The Barra Acquisition (2004)
In 1975 a University of California economist named Barr Rosenberg founded a company in Berkeley around an idea that now sounds obvious. A stock's risk is not one number. It is the sum of many exposures: to its industry, its country, its size, its sensitivity to interest rates, its tendency to move with "value" or "growth" styles. Break a portfolio into those factors and a manager can see what bets they are really making, how far their fund is likely to stray from its benchmark, and which positions drive that gap. Barra turned the insight into software, and over three decades its factor models became the common language of risk in active equity management.
To understand why that mattered, think of the index as the scoreboard and the risk model as the coach's playbook. MSCI told managers what the score was. Barra told them, every day, how their portfolio was positioned relative to that score and where they might lose. A manager could ignore the scoreboard for a while. No serious institutional manager could run money without a risk system, and Barra's was the one most of them used.
On 6 April 2004, Morgan Stanley and Barra announced that the bank would buy Barra for $41 a share in cash, about $816 million in total, and combine it with MSCI.5 The press release promised a leading global provider of both benchmark indexes and risk analytics. The combined business traded for a time under the name MSCI Barra, and the strategic logic was straightforward: sell factor models and portfolio-construction tools to the same institutional desks that already licensed MSCI benchmarks.
The more interesting logic was about switching costs. Once a manager's risk budget, tracking-error limits and compliance rules are expressed in Barra factors measured against an MSCI benchmark, changing the benchmark is no longer a one-line edit to a contract. It means rebuilding risk reports, recalibrating limits and explaining the change to clients and consultants. The acquisition took a product that lived at the edge of a client's process, the scoreboard, and tied it to one that lived at the center, the daily risk run.
Was it a distraction from the pure index economics? The record gives a mixed answer. Analytics remains a large business, at 22.8% of 2025 revenue, and the subscription base it built is part of why MSCI's revenue held up so well later on.2 But Analytics has never come close to the economics of the index franchise. Its margins sit well below Index, its growth has been slower, and it competes against capable rivals and in-house systems in a way benchmarks do not. Barra bought MSCI a second toll booth, but on a busier road with more alternative routes.
The fairest verdict is that Barra widened the moat more than it deepened the profit pool. It made MSCI part of the workflow of active managers, not just their reporting, and it built the template for selling many products to the same client. It also planted the idea that MSCI could grow by buying adjacent analytics, an idea that would get far more expensive within six years. Before that, though, the company had to survive leaving home.
V. The Great Escape: IPO and the Separation from Wall Street (2007–2009)
By 2007 Morgan Stanley owned something odd: a high-margin, subscription-funded business with almost no need for the bank's capital, sitting inside a firm whose own model depended on leverage and trading. The two had little to do with each other. Clients still worried about the conflict between the bank's trading desks and the index committee, and the bank's shareholders gave it little credit for a data company buried in its accounts.
So Morgan Stanley took MSCI public. The prospectus offered shares at $18 each in November 2007, raising roughly a quarter of a billion dollars while the bank kept the large majority of the stock.1 The timing looks extraordinary in hindsight. Bear Stearns would collapse four months later, Lehman Brothers in ten. Morgan Stanley itself would come close to the edge in September 2008, convert into a bank holding company and accept federal capital. Investors buying MSCI were buying into the most capital-light business in the industry just as the industry's balance sheets were about to fail.
The company's subscription model proved its worth in the storm. Clients paid annually and in advance, and an index subscription or a risk system is among the last things an asset manager cancels, because without it they cannot report to their own clients. Asset-based fees fell with markets, but most revenue held. The contrast with the parent could hardly have been sharper.
For Morgan Stanley, the stake became a source of liquidity it needed. It sold down shares through the crisis and, in May 2009, announced the sale of its remaining interest, ending twenty-three years as parent.[^6] Whether the bank sold too cheaply is easy to answer with hindsight; the shares it let go for well under $30 trade above $550 today. But the sale was a rational response to a capital crisis, and MSCI arguably could not have become what it did while still inside the bank.
Independence was the dividend. MSCI could now present itself as a neutral utility, free to license indexes to BlackRock, Vanguard, State Street and every regional fund manager without any of them wondering whether their data supplier was also their competitor's trading partner. The index committee's decisions no longer came from inside a bank. That neutrality is not a soft asset: an index provider's whole value rests on the belief that its rules are applied without favor.
Fernandez, now running a public company rather than a division, had a free hand and a clean balance sheet. He used both almost immediately, and much more aggressively than anyone expected.
VI. The RiskMetrics Aggression and the VaR Monopoly (2010)
On 1 March 2010, less than ten months after Morgan Stanley's final exit, MSCI announced that it would buy RiskMetrics Group in a cash-and-stock deal valued at about $1.55 billion.[^7] For a company that had been public for barely two years, it was a bet of startling size, roughly comparable to its own market value at the time, and it was funded partly with new debt and new shares.
RiskMetrics carried a famous lineage. It had grown out of J.P. Morgan, which in the 1990s popularized Value-at-Risk, a single number meant to answer the question a chief executive could understand: on a bad day, how much could this portfolio lose? Spun out in 1998, RiskMetrics became the leading independent supplier of that kind of measurement for multi-asset portfolios, including bonds and derivatives where Barra's equity heritage was thinner.[^7] It also owned Institutional Shareholder Services, the proxy adviser that tells institutional investors how to vote at shareholder meetings.
The timing was deliberate. In the aftermath of the crisis, regulators everywhere demanded that banks and asset managers measure and report risk more rigorously. European fund rules, bank capital rules and new American reforms all pushed institutions toward daily, documented risk calculation. Fernandez's ambition was to make MSCI the indispensable supplier of what he called investment decision support: the benchmark, the equity factor model and the multi-asset risk engine, all from one firm.
That concentration made some clients uneasy. A single vendor now sat behind the measure of performance, the measure of equity risk and a large share of the measure of total portfolio risk for much of the institutional world. The worry was less about antitrust law than about dependence: if so many firms compute risk the same way, they may also make the same mistakes at the same moment, and their bargaining power over price shrinks.
ISS quickly proved the weak link. Proxy advice is politically charged, reputationally risky and unrelated to MSCI's data economics, and corporate America regularly attacked proxy advisers for their influence. In March 2014 MSCI agreed to sell ISS to Vestar Capital Partners for $364 million in cash.6 The headline lesson is that part of the 2010 purchase was a misfit, sold off within four years.
Was RiskMetrics worth it? The case for the deal is that it extended MSCI from equities into multi-asset risk and regulatory reporting, product lines that still sit inside Analytics today and that are sold to the same clients. The case against is that Analytics, the segment those businesses fed, has grown more slowly and earned lower margins than the index business throughout the years since. Revenue in 2014, the year of the ISS sale, actually fell 3.8%, a reminder that disposals and integration cost the company several years of momentum.[^9] The honest conclusion is that RiskMetrics bought scope rather than a second monopoly. It made MSCI broader and stickier with large clients, but the real profit engine remained the ruler it had owned since 1969, which is where the story turns next.
VII. Anatomy of the Toll Booth: 76% Margins and BlackRock's Shadow
Picture an asset allocator in Tokyo moving money into a global equity ETF run by BlackRock's iShares. The investor pays BlackRock a small annual fee. BlackRock, under its licence, pays a contractual slice of the assets in that fund to MSCI. Nothing at MSCI changes: no new server, no new analyst, no new salesperson. The index was going to be calculated that day anyway. The extra fee drops almost entirely into profit.
That is the economics of MSCI's Index segment, which produced 57% of group revenue in 2025 and earned an adjusted EBITDA margin of about 77%.2 Very few businesses of any size earn margins like that. For comparison, the rest of MSCI, the Analytics, Sustainability and Climate, and Private Assets segments together, makes up the other 43% of revenue at materially lower margins. Index is therefore responsible for something like three-quarters of the company's operating profit. When people describe MSCI as a toll booth, it is this segment they mean.
Inside Index there are two very different kinds of money. Most is subscription revenue: asset managers, banks, consultants and asset owners paying annual fees for index data, used for benchmarking, research and reporting. The rest, about 43% of Index revenue, is asset-based, earned as basis-point fees on money in ETFs, mutual funds and other products that track MSCI indexes, plus fees on futures and options listed on MSCI indexes.2 Across the whole company that asset-based line is close to a quarter of revenue. The subscriptions behave like software. The asset-based fees behave like a royalty on world equity markets.
That distinction explains the recent numbers. In the second quarter of 2026, revenue rose about 12% to $867 million, and asset-based fees jumped almost 27% as markets and ETF inflows climbed.[^10] Recurring subscriptions grew about 9%. The fastest-growing line is also the most cyclical, which is exactly what investors should expect from a royalty on asset prices.
Now the shadow. BlackRock accounted for 10.8% of MSCI's 2025 revenue, and 96.5% of that came from fees on BlackRock products tracking MSCI indexes.2 In plain terms, roughly one dollar in every ten MSCI collects depends on the size of iShares funds benchmarked to MSCI and on the fee rate the two companies have negotiated. The company does not disclose the rate BlackRock pays or its top-ten client concentration.
Why does BlackRock not simply switch to a cheaper index, or build its own? Because an ETF tracking MSCI Emerging Markets is, to its investors, an MSCI Emerging Markets product. Changing the index means changing the prospectus, notifying shareholders, explaining a new benchmark to advisers and model portfolios, and selling and buying securities to match the new rules, which can generate taxes and trading costs for the fund. For the largest international funds, the friction is substantial. But substantial is not infinite.
The proof came on 2 October 2012. Vanguard, the other giant of indexing, announced that it would move 22 index funds, including its huge emerging-markets fund, from MSCI benchmarks to FTSE and to the University of Chicago's Center for Research in Security Prices, citing licensing cost savings.7 MSCI's shares fell by roughly a quarter that day. Vanguard showed that a sponsor large enough and determined enough to absorb the hassle can walk away, and that the market will instantly reprice MSCI's moat when one does.
The record since then narrows the original claim rather than rejecting it. Vanguard's defection did not trigger a stampede; MSCI's index revenue kept compounding and BlackRock remained its largest client. But the episode proved that the switching cost protecting asset-based fees is a cost the client weighs against savings, not a wall. The right version of the thesis is this: MSCI's subscription relationships are close to captive, while its biggest asset-based relationships are negotiated partnerships in which the customer has real leverage, and that leverage caps the fee rate even as assets grow.
The cash, though, is beyond argument. In 2025 MSCI generated about $1.6 billion of operating cash flow and $1.5 billion of free cash flow on net profit of about $1.2 billion.[^9] The gap exists because much of the expense in the accounts is non-cash, mainly amortization of acquired intangibles and stock compensation, and because clients pay annually in advance. Those prepayments mean MSCI's working capital runs at about minus 82 days of revenue: customers fund the business before it delivers the service. Receivables look high, at around 115 days, for the same reason, since invoices go out up front, rather than because clients pay late.[^9]
So MSCI turns roughly half of every dollar of revenue into free cash. The question every great cash machine eventually faces is what to do with it, and MSCI spent the next decade answering in two ways: buying new frontiers, and buying back itself.
VIII. The Frontier Expansion: ESG, China A-Shares, and Private Capital (2014–2024)
In June 2017, after three consecutive years of saying no, MSCI announced that it would begin including Chinese domestic A-shares in its Emerging Markets Index.8 For years Beijing had lobbied for the decision, and for years MSCI had held back, citing concerns that international investors raised directly: limits on moving money out of China, frequent trading suspensions, and rules that required approval before launching products linked to Chinese shares. Chinese regulators eased several of those restrictions, and in the summer of 2018 the first 234 large mainland companies entered the benchmark at a small initial weight.9
The episode is the clearest display of what MSCI's index power really means. A private American company effectively told the world's second-largest economy what it had to change before its stock market could be counted as investable, and the government changed it. When the inclusion took effect, every passive fund tracking the index had to buy, and active managers benchmarked to it had to decide whether to follow. Billions of dollars moved on a methodology decision.
The same power exposed MSCI to politics it could not control. In late 2020 an American executive order barred US investment in companies designated as linked to China's military, and MSCI removed a group of Chinese companies from its indexes in December 2020.10 The company had to follow Washington's rules while being lobbied by Beijing, and every index decision about China became a geopolitical statement whether MSCI wanted it or not.
In the same years MSCI built the market's leading ESG ratings franchise, scoring thousands of companies on environmental, social and governance risks and selling those ratings and related indexes to asset managers. During the sustainable-investing boom it looked like a natural extension of the index business. Then the backlash came. American state officials attacked ESG investing as political, critics questioned whether ratings that produced very different scores from rival providers measured anything consistent, and European regulators moved to supervise ESG rating providers. Sustainability and Climate now accounts for about 11% of MSCI's revenue, a meaningful business but not the second growth engine it once promised to become.2
The bigger strategic bet was private markets. Over the past fifteen years pension funds and endowments moved trillions of dollars into private equity, private credit, infrastructure and property, assets that have no daily price, no public index and often no reliable data at all. If public markets made MSCI rich by owning the ruler, private markets offered the chance to build a new ruler from scratch.
MSCI went shopping. It bought Real Capital Analytics, a commercial real estate transaction database, in 2021, a deal that helps explain why investing outflows topped $1 billion that year.1 Then in October 2023 it completed the purchase of Burgiss, a firm that collects cash-flow data reported by private funds to their investors, paying about $697 million for the stake it did not already own.[^15] Smaller purchases followed in climate and private-asset analytics in 2024.2
How has the private-markets bet paid off? So far, slowly. Private Assets contributed 8.9% of revenue in 2025, after an investment approaching $2 billion across the main deals.2 That is a decent data business, but nowhere near the toll economics of a public benchmark. The obstacle is structural. A public index works because everyone can see the same prices and the provider can define the market. Private-market data depends on fund managers and investors agreeing to share their numbers, and the incumbents in private-markets data include well-funded rivals. Buying the data is the easy part. Persuading the industry to adopt your data as its definition is the part that created MSCI's original fortune, and it cannot be bought.
The decade's expansion therefore leaves a clear verdict. China inclusion proved MSCI's influence and also tied it to geopolitics. ESG grew fast and then hit political and regulatory resistance. Private markets remain a real opportunity whose conversion into benchmark-style power is unproven. All three were attempts to find growth beyond the core franchise, and none has yet produced a second index business. Meanwhile, a different strategy was pushing earnings per share up far faster than any of them.
IX. The Balance Sheet Engineering: Negative Equity and the Debt Machine
In August 2025 MSCI sold new bonds: $1.25 billion due 2035 and $500 million due 2036, at coupons of 5.25% and 5.15%.11 The company did not need the money to fund operations; it generated about $1.5 billion of free cash flow that year. It needed it, in effect, to keep returning more cash to shareholders than the business produced.
This is the mechanism behind one of the strangest numbers in MSCI's accounts. At the end of 2014 shareholders' equity stood at about positive $1.4 billion. By the end of 2025 it had fallen to about negative $2.7 billion, while total borrowings rose from about $800 million to $6.3 billion.[^9] Nothing went wrong in the business. MSCI simply spent more on dividends and buybacks than it earned, year after year, and funded the difference with debt. Every share repurchased removes cash and equity from the balance sheet; do it with borrowed money for long enough and book equity goes negative.
In financial terms, MSCI has run a slow-motion leveraged recapitalization on itself, the same playbook a private-equity owner would use on a business with steady cash flows: load it with debt, return the cash, let the shrinking share count lift per-share earnings. And it worked. Earnings per share rose from $2.51 in 2014 to about $18 over the past twelve months, net profit compounding at about 18% a year over ten years.[^9] Part of that came from higher margins, part from a lower tax rate after the 2017 US tax reform, and part from fewer shares.
Dividends alone reached $556 million in 2025, nearly half of net profit, and buybacks came on top.[^9] In the second quarter of 2026 and into July, the company spent about $147 million buying back roughly 264,000 shares at an average price near $558.[^10]
The cost of the strategy is rising. Most of MSCI's older notes, due between 2029 and 2033, carry coupons between about 3.25% and 4%. The new paper costs more than 5%.1 11 Each refinancing at today's rates lifts interest expense and reduces the cash left over for shareholders. Net debt is now roughly 3.3 times EBITDA, a level the business can carry comfortably but that leaves limited room for more debt-funded buybacks.
The credit agencies have already decided how much room. S&P raised MSCI to BBB-, the lowest investment-grade rating, in February 2023, and Moody's lifted it to the equivalent Baa3 in May 2024, citing scale, profitability and cash generation; Fitch also rates it BBB-.12 13 The upgrades are evidence of strength: the agencies judged that the cash flows support the debt. But they also place MSCI on the bottom rung of investment grade at all three agencies. One notch lower, and $6.3 billion of debt would become high-yield, raising future borrowing costs and narrowing the pool of buyers.
What would an activist say? Probably that MSCI's operating margin has stopped expanding. It climbed from about 34% in 2014 to above 52% by 2020, and has stayed between roughly 53% and 55% since.[^9] With margins flat, debt-funded buybacks have done more of the work in keeping earnings per share rising faster than profit. That is not dishonest. It is a choice, and it has a limit. Once leverage reaches the level the rating agencies tolerate, per-share earnings can grow only as fast as profit plus whatever free cash flow buys back. The decade when financial engineering added several points a year to EPS growth is ending, which makes the people deciding how to allocate that cash more important than ever.
X. The Executive Suite: Henry Fernandez and the $1,000 Strike Price
On 27 January 2025, MSCI's compensation committee approved an unusual award for its 67-year-old chairman and chief executive.3 Henry Fernandez received a one-time grant of options worth about $15 million, split into three tranches with strike prices of $1,000, $1,100 and $1,200 a share, roughly 69% to 103% above where the stock traded when the award was approved.3 The options are worth nothing unless the shares reach those levels. With the stock around $555 in October 2026, they remain well out of the money.
Read generously, the award is an unusually blunt statement of ambition: the board asked its long-serving leader to roughly double the company's value before being paid for it. Read skeptically, it is a large grant to a CEO already rich from decades of stock ownership, at a time when the investment community was questioning MSCI's growth rate. The two readings can both be true. What is beyond doubt is that the reward is tied to the share price, not to an adjustable earnings target.
Fernandez's record makes the case for him. He has led the business since 1998, through its time inside Morgan Stanley, the IPO, the financial crisis and every major acquisition, and over that span revenue, margins and per-share earnings have compounded at rates very few companies match.[^9] He is also the architect of the decisions that have not paid off as hoped: the oversized RiskMetrics bet, the ISS misfit, the ESG franchise that hit political headwinds, and private-markets acquisitions that remain small. That is the profile of a builder who takes big swings, not of a flawless allocator.
His total pay for 2024 was about $15.7 million, most of it in equity.3 Shareholders have been comfortable with that design. At the annual meeting on 22 April 2026, about 59.1 million votes supported the pay package and about 4.1 million opposed it, roughly 93.5% approval, and all eleven directors were re-elected.14 In an era of frequent shareholder revolts over pay, that is solid support.
The governance risk lies elsewhere. Fernandez holds both the chairman and CEO roles, has done so for decades, and turned 68 in 2026. Baer Pettit, his long-time president and the executive most often seen as an operating partner, stepped down on 1 March 2026.2 That leaves chief financial officer Andrew Wiechmann, in the role since 2020, as the most visible senior executive alongside the CEO, and no publicly named successor. MSCI has not announced a succession plan.
For a business whose strategic choices, from methodology to capital return, have been shaped by one person for nearly three decades, the absence of a clear heir is the most important governance question it faces. A standard-setting franchise can run for years on momentum. The decisions that matter, though, such as when to fight a fee cut, how much leverage to carry or whether to make another large acquisition, are made by people, and the next set of people has not yet been revealed. Whoever they are will inherit a moat that is real but not uniform.
XI. The Moat and the Oligopoly: Porter's Five Forces and 7 Powers
Imagine an asset manager that decides to save money by launching an emerging-markets fund tracked against its own in-house index. The methodology is reasonable, the costs are lower, the fund is cheaper. Then it meets the pension consultants. Their clients' policy statements specify MSCI benchmarks; their performance databases compare managers against MSCI; their committees want a track record measured against the standard. The fund launches to a room with very few buyers. That imagined scene is the moat in its purest form, and it explains why global index provision has remained an oligopoly of three firms: MSCI, S&P Dow Jones Indices and FTSE Russell.4
The three have divided the world roughly by geography and history. S&P owns the American large-cap standard. FTSE Russell is strong in American small caps and in the UK. MSCI dominates global, international and emerging-markets equity, the benchmarks that measure everything outside a home market. That division matters, because MSCI's franchise sits where switching is hardest: international portfolios have the most countries, the most methodology choices and the deepest embedding in institutional mandates.
Hamilton Helmer's framework of seven strategic powers helps explain why. The strongest power MSCI holds is a network economy. Asset owners write MSCI into mandates, so managers license MSCI, so consultants measure against MSCI, so ETF sponsors use MSCI to attract assets, so exchanges list futures on MSCI, so banks price derivatives off MSCI. Each participant's choice makes the standard more useful for the others. Breaking it requires coordinating them all at once, which no competitor has managed in international equities.
The second power is switching cost, and the evidence for it is retention. MSCI kept about 95% of its subscription revenue in the second quarter of 2026, up from about 93% at the end of 2025.[^10] 2 Clients rarely leave because leaving means rewriting guidelines, risk systems and reports. Organic recurring subscription run-rate growth of about 8% shows the company can also add products and raise prices on its existing base.[^10]
There is also an element of cornered resource. MSCI holds more than fifty years of consistent index history across many countries, built from a long record of corporate actions and methodology decisions. A new entrant could calculate a world index tomorrow; it cannot produce a fifty-year track record that consultants trust. Brand plays its part too, since an MSCI benchmark functions as a fiduciary's proof of a prudent, conventional choice.
Michael Porter's five forces sharpen where the moat is weaker. The threat of new entrants in international benchmarks is close to zero, because the network and history cannot be copied. Rivalry is real but bounded: domestic US indexes have seen aggressive fee competition as the largest ETFs fight on cost, while MSCI's emerging and international franchises have been more insulated. The threat of substitutes is growing at the edges. Direct indexing, where an adviser builds a custom portfolio of individual stocks for tax reasons, and self-indexing by large managers both reduce the need to license an index for some products. They have not yet displaced the pooled benchmark at the heart of institutional mandates, and the company's growth suggests they remain marginal.
Buyer power is the force that genuinely limits MSCI, and it is concentrated in the asset-based business. BlackRock's share of revenue and the Vanguard defection show that the largest ETF sponsors can negotiate hard and, in extreme cases, leave. Supplier power is negligible; MSCI's main inputs are exchange price data and skilled people. As for artificial intelligence, it can lower the cost of computing an index or building analytics, but it cannot manufacture the institutional consensus that makes a benchmark valuable. The greater AI risk is to the Analytics and data businesses, where cheaper tools could pressure prices; the company does not quantify that exposure.
The verdict on the moat is therefore precise rather than absolute. MSCI's index subscription franchise in international equities is one of the most defensible positions in finance, protected by network effects and switching costs and confirmed by high retention. Its asset-based fees are protected but negotiable, capped by powerful buyers. Its other segments have good businesses but ordinary moats. That shape, a near-monopoly core surrounded by competitive edges, is what the lessons of this story are built on.
XII. Playbook: Business & Investing Lessons
Set two numbers next to each other: an operating margin of almost 55% and shareholders' equity of minus $2.7 billion. Most companies would be proud of the first and alarmed by the second. At MSCI they are two sides of one design, a business so asset-light that it can hand back more than it owns and still be worth over $40 billion. That combination holds four lessons that belong to this company and no other.
The first lesson is to own the standard, not the product. The old saying holds that in a gold rush you sell picks and shovels. MSCI did something better: it became the assay office that certifies whether the gold is real. Capital International did not set out to build a monopoly in 1969; it set out to make cross-border investing measurable. But once trustees wrote EAFE into contracts, every participant in the system had a reason to keep using it, and the company that defined the market was paid by everyone who entered it. In any industry where buyers fear being blamed for an unconventional choice, the standard is worth more than the best product. Fear of career risk is the most durable customer of all.
The second lesson is that operating leverage runs out before financial leverage does, and that is exactly when financial leverage becomes dangerous. MSCI's margin climbed by about twenty points over a decade, then stopped. During the climb, debt-funded buybacks multiplied an already rising profit. On the plateau, the same buybacks have to do more of the work, and every new bond at 5% does it at a higher price. A company can borrow to amplify growth; it cannot borrow its way into more of it. The line to remember: a balance sheet can make a great business look faster, but never make it grow.
The third lesson concerns the customer who is also your distributor. BlackRock's iShares carried MSCI indexes into the portfolios of millions of investors, and that partnership built much of the asset-based revenue that now grows faster than anything else at MSCI. It also gave a single client a tenth of the company's revenue and the leverage that comes with it. Vanguard showed what that leverage can do in a single morning in 2012. The lesson for any platform: the partner who brings you scale also learns exactly what you are worth to them, and negotiates accordingly.
The fourth lesson is that acquisitions can buy products but not consensus. Barra and RiskMetrics bought tools that clients used every day, and those tools made MSCI harder to leave. But the purchases that tried to recreate the original magic, in ESG ratings and in private-markets data, have so far produced respectable businesses rather than new standards. A network effect is a gift from a market that has agreed on something; it cannot be acquired with a cheque, however large. That is why MSCI's next chapter depends less on what it buys and more on whether private-market investors ever agree to be measured by its ruler.
XIII. Analysis & Bear vs. Bull Case
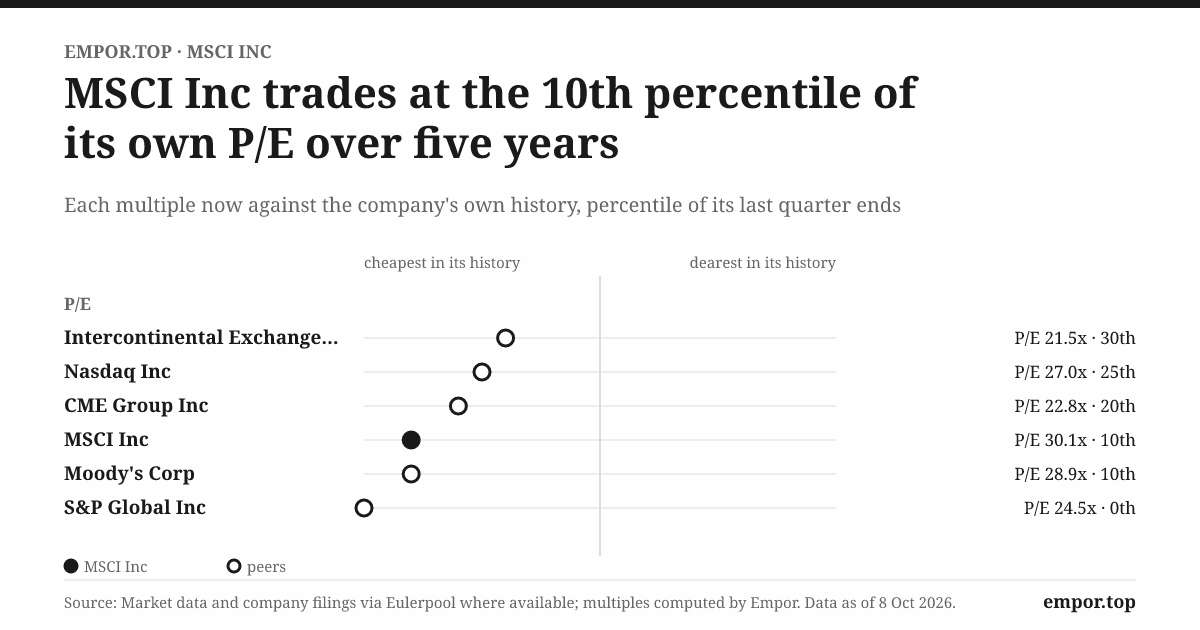
Picture an analyst on 8 October 2026 looking at two numbers. MSCI's shares trade at about 30 times earnings, against a median of about 36 times over the previous five years.[^9] The stock is about 13% below its 52-week high and has fallen as much as 44% from a peak at one point in those five years. Is the lower multiple an opportunity the market has missed, or the market's recognition that growth is slowing?
The valuation, taken as data rather than a verdict, says the market still expects a lot. An enterprise value of about $47 billion is around 23 times EBITDA and 14 times sales, and the free-cash-flow yield is under 4%. The PEG ratio, the price-to-earnings multiple divided by expected growth, is about 2.3, high by most standards. Those numbers assume MSCI keeps compounding earnings at roughly double-digit rates for many years with few setbacks. The derating from the 2021-era multiples reflects a market that no longer pays a premium for the expectation that growth will accelerate.
The bull case begins with the long migration from active to passive investing, which is far less advanced outside the United States. If international investors keep moving toward index funds and ETFs, much of that money will track MSCI benchmarks, and asset-based fees will compound with it. The second strand is private markets: if Burgiss data becomes the reference for measuring private fund performance, MSCI would own the only ruler that spans public and private portfolios. The third is the subscription engine, with retention around 95% and organic recurring growth around 8%, which suggests real pricing power independent of markets.[^10] Finally, at margins around 55%, the business generates more than $1.5 billion of free cash a year through most cycles, which provides flexibility in nearly any environment.
The bear case starts with beta. About a quarter of revenue is tied to asset levels, and the cost base is largely fixed. A prolonged fall in global equities would shrink that revenue while costs stayed put, compressing the margin investors have come to treat as permanent. The second strand is the debt ceiling. With equity deeply negative, leverage around 3.3 times EBITDA and ratings at the lowest investment-grade notch, the company cannot keep adding debt to fund buybacks, so per-share earnings growth will converge with profit growth. The third is fee pressure: as the largest ETFs grow, sponsors like BlackRock have every reason to negotiate lower basis-point rates, and the Vanguard episode shows what happens when they decide a cheaper rival is good enough. The fourth is geopolitics, since a deepening split between the American and Chinese capital markets threatens the global, cross-border investing on which MSCI's franchise depends.
A skeptical investor would test the case with one scenario. Suppose global equities fell about 20% and stayed there for a year. Asset-based fees would fall roughly in line, taking perhaps 5% off group revenue, and because those fees carry almost no incremental cost, most of that loss would come straight out of EBITDA. Net debt would stay where it is. Leverage could rise from about 3.3 toward 3.6 or more times EBITDA, and if subscription growth also slowed as clients cut budgets, toward 4 times. That would not threaten MSCI's solvency; the subscription base and cash generation would remain strong. It would, however, put pressure on the ratings, force a pause in buybacks and probably slow per-share earnings growth to low single digits for a period. The stress test therefore narrows the bull case without breaking it: the franchise survives a bear market, but the financial engineering does not.
Three indicators settle most of the debate. The first is organic recurring subscription run-rate growth, around 8% in the latest quarter, which measures the business independent of markets.[^10] The second is subscription retention, about 95% and rising, which tests the switching-cost moat. The third is net debt to EBITDA, around 3.3 times, which shows whether capital return has reached its limit. If the first holds near 8% through a flat or falling market, the franchise is as strong as its admirers say. If it slips toward the low single digits while asset-based fees carry the growth, the company is more market-linked than its valuation assumes.
XIV. Epilogue: The Next Inflection
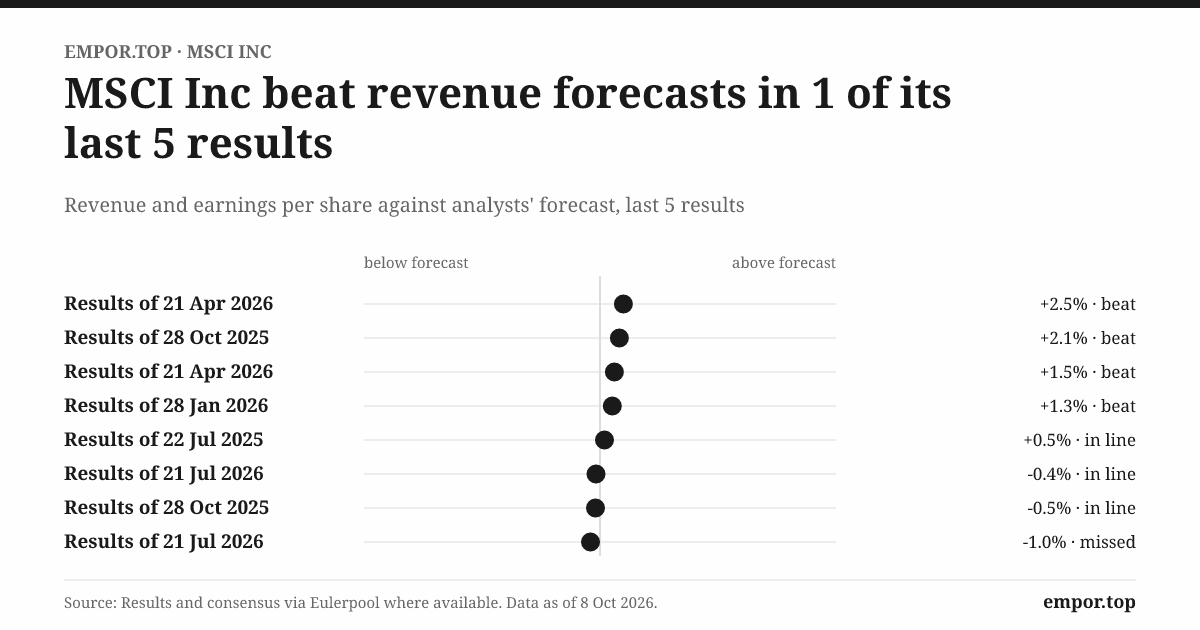
Tonight MSCI stands in an unusual position. Its most recent quarter was among its strongest in two years, with revenue up about 12% and operating margin above 56%.[^10] Its shares nonetheless trade well below their historic multiple, and the people and the balance sheet that will determine the next decade are both in transition.
The first test is leadership. Fernandez has run the company for nearly three decades, and his president has left. The board will at some point announce a successor, and that choice will reveal what MSCI believes it is. An internal product leader would signal continuity: a standard-setter that keeps extending its methods into new assets. An external capital allocator would signal that the next phase is about cash returns from a mature franchise. Either choice, and its timing, will tell investors more about the next decade than any earnings release.
The second test is the debt. MSCI's 4% notes due 2029 and 3.625% notes due 2030 will need refinancing in an environment where its latest bonds cost more than 5%.11 Each refinancing will raise interest expense. The rating agencies will keep reviewing a company that sits on their lowest investment-grade rung, and any change in outlook would signal that the leverage strategy has gone as far as it can.
The third test is private markets. The question is not whether MSCI sells more private-asset data, which it probably will, but whether investors and fund managers begin formally benchmarking private fund returns against MSCI and Burgiss indexes. That would be the signal that MSCI is building a second standard rather than a second data business, and it is the only development that could justify the prices the company paid.
The fourth test is the one that matters most and is hardest to see in a single quarter: whether subscription growth holds near 8% when markets stop rising. Every investor in MSCI is ultimately betting that its strength comes from the ruler, not from the rising tide it measures. The next bear market will provide the evidence.
XV. Outro
Stand on a trading floor in London, New York, Hong Kong or Tokyo and the screens show thousands of stocks, bonds and derivatives moving at once. Somewhere on most of those screens, in a corner, is the same four-letter abbreviation. It tells the portfolio manager whether the day was won or lost.
That is what Capital International started building in 1969, what Morgan Stanley owned without fully valuing, and what Henry Fernandez turned into one of the most profitable businesses in finance. Companies rise and fall, star managers come and go, and the debt on MSCI's balance sheet will eventually find its limit. But as long as capital crosses borders and someone has to answer whether it did well, the answer will be measured in MSCI's units. Wall Street creates the assets. MSCI owns the ruler.
References
-
Morgan Stanley Capital International Inc. Prospectus Form S-1/A Initial Public Offering — SEC EDGAR, 2007-11-14 ↩↩↩↩↩↩↩
-
MSCI Inc. Form 10-K for the Fiscal Year Ended December 31, 2025 — SEC EDGAR, 2026-02-12 ↩↩↩↩↩↩↩↩↩↩↩↩↩↩
-
MSCI Inc. Definitive Proxy Statement Form DEF 14A — SEC EDGAR, 2026-03-10 ↩↩↩↩
-
The Index Oligopoly: How Index Providers Built Wall Street's Most Lucrative Toll Booth — Financial Times, 2021-09-14 ↩↩
-
Barra to Be Acquired and Combined with MSCI — MSCI Press Release, 2004-04-06 ↩
-
MSCI Inc. Form 8-K on Agreement to Sell Institutional Shareholder Services — SEC EDGAR, 2014-03-18 ↩
-
Vanguard Drops MSCI as Benchmark Provider for 22 Index Funds — Reuters, 2012-10-02 ↩
-
MSCI Decides to Include China A-Shares in Emerging Markets Index — Financial Times, 2017-06-20 ↩
-
Behind China's Push for MSCI Inclusion — The Wall Street Journal, 2018-05-31 ↩
-
Trump Administration Order Forces MSCI to Cut Chinese Companies From Benchmark Indexes — Bloomberg, 2020-12-15 ↩
-
MSCI Inc. Form FWP Filing for Senior Notes Offering — SEC EDGAR, 2025-08-11 ↩↩↩
-
MSCI Announces Upgrade to 'BBB-' Investment Grade Rating from S&P Global Ratings — Business Wire, 2023-02-27 ↩
-
MSCI Announces Upgrade to 'Baa3' Investment Grade Rating from Moody's Ratings — Business Wire, 2024-05-13 ↩
-
MSCI Inc. Form 8-K Results of 2026 Annual Meeting of Shareholders — SEC EDGAR, 2026-04-24 ↩
 LinkedIn
 WhatsApp
 Reddit
 Hacker News
 Email
 Kindle
 RSS Feed
 Spotify
 Apple Podcasts
 Amazon Music
 Audible
 YouTube