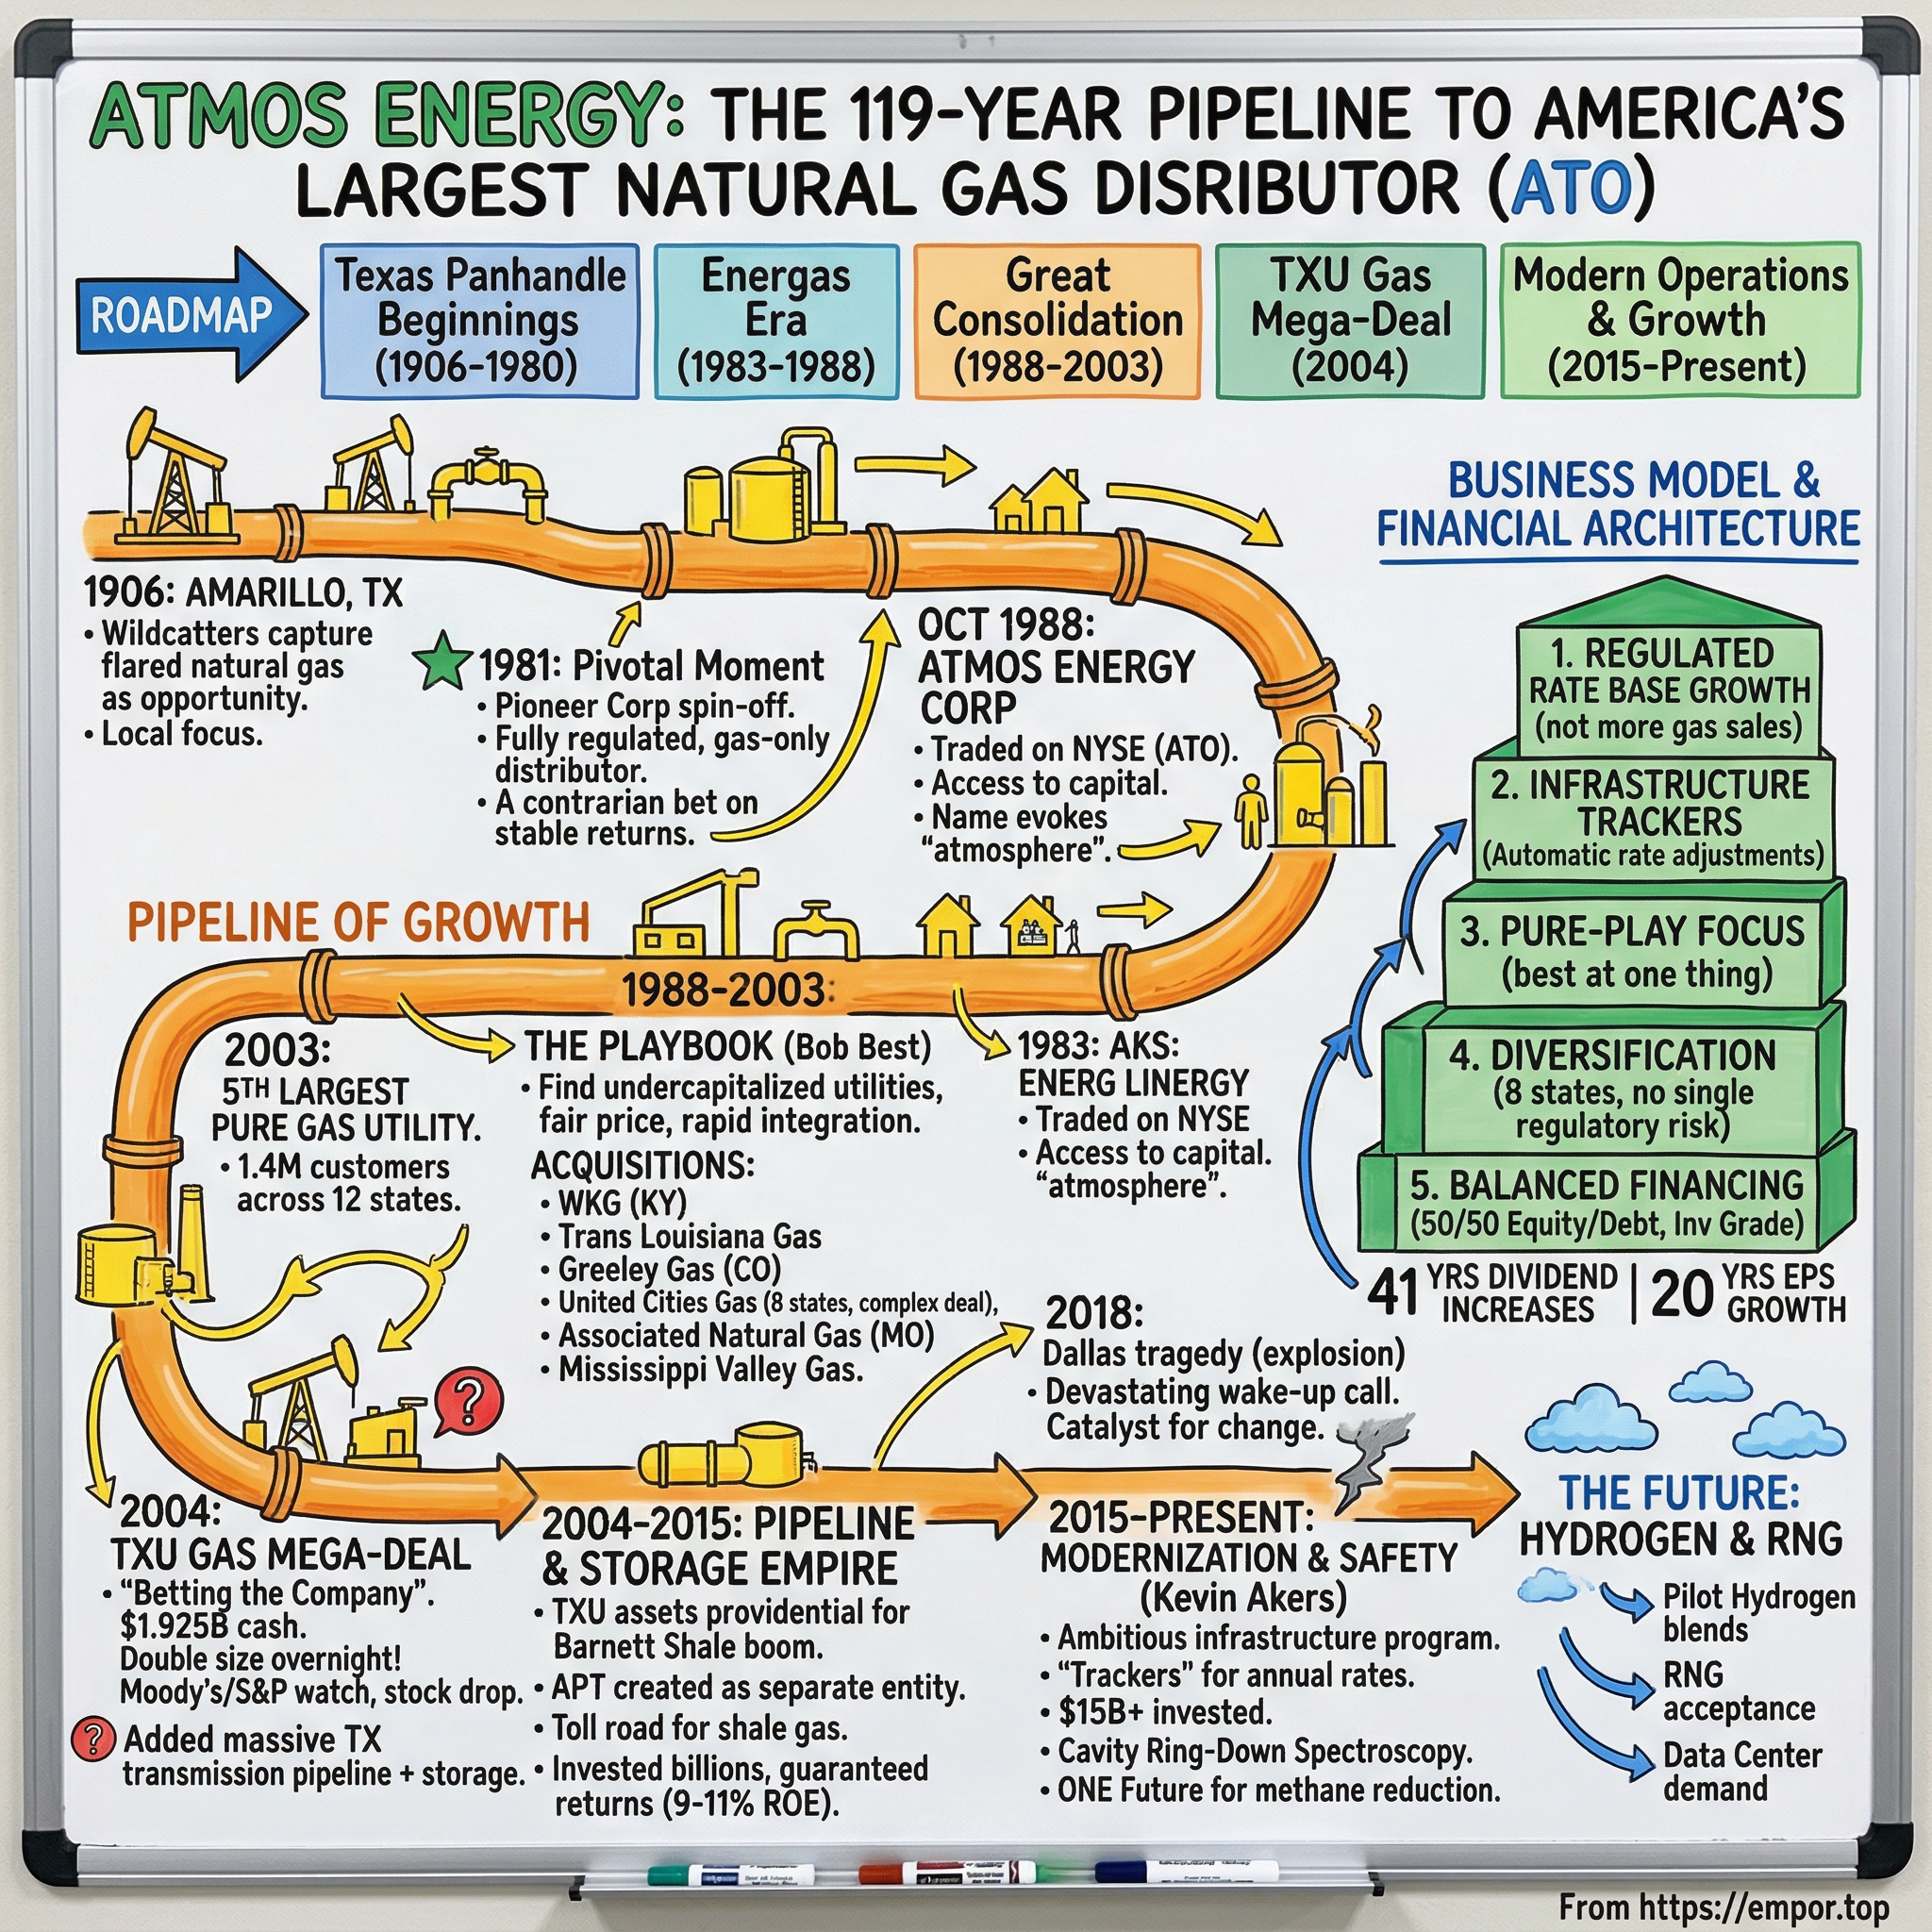
Atmos Energy: The 120-Year Pipeline to America's Pure-Play Gas Monopoly
I. Introduction & Episode Roadmap
On a February morning in 1906, two brothers named J.C. and Frank Storm began tearing up the unpaved streets of Amarillo, Texas, to lay pipe for a company that made gas out of coke and oil.7 They were not selling natural gas. Natural gas, at that point in the Texas Panhandle, was mostly regarded as a nuisance — the byproduct that came screaming out of a hole when drilling for oil, which operators flared off or vented into the sky. The Storms were selling manufactured town gas for lamps and stoves, and their business existed primarily because Amarillo had streets, houses, and no alternative heating source.
One hundred and twenty years later, the corporate descendant of that enterprise is Atmos Energy Corporation, the largest pure-play natural gas distributor in the United States. As of June 30, 2026, it served roughly 3.4 million meters across eight states through six regulated distribution divisions, and moved gas across roughly 5,700 miles of its own intrastate transmission pipeline inside Texas.4 In fiscal 2025, it earned $1.2 billion in net income, or $7.46 per diluted share, while spending $3.6 billion on capital investments — three times its net income.1 That spending-to-income ratio defines the financial model of the modern company.
The central question this analysis addresses is deceptively simple: How does a business whose product is a commodity it does not profit from, sold to captive customers at prices set by regulatory commissions, generate 24 consecutive years of earnings-per-share growth and 42 consecutive years of dividend increases?2 The critical follow-up: how much of that record stems from a durable structural advantage, and how much relies on state-level regulatory mechanisms subject to legislative revision?
The core paradox is that natural gas distribution — an industry facing ESG divestment trends and building-electrification mandates — has remained one of the most consistent compounders among American utilities. The underlying driver is financial plumbing: in most of Atmos's operating jurisdictions, the company can adjust customer rates for new capital investment within months of spending, avoiding multi-year rate case delays. Management reports that more than 90 percent of annual capital spending begins earning a return within six months, and roughly 99 percent within twelve.2 When a utility turns capital expenditure into earning rate base almost immediately, the capital budget effectively dictates the growth rate.
That mechanism also introduces vulnerability. Rapid cost recovery transfers capital burdens directly to consumers. The Atmos Cities Steering Committee — a coalition of more than 150 north and central Texas municipalities representing roughly 1.2 million residential customers — projected that average residential bills in its footprint could rise from about $80 per month in 2025 to about $121 by 2030 if the current capital plan proceeds.16 A business model grounded in regulatory approval requires continuous political and public renewal.
The story unfolds across several key phases. It begins in the Panhandle with a manufactured-gas utility that expanded into a diversified energy conglomerate before spinning off its regulated division in 1983 as an independent entity. It traces the roll-up era, when Atmos acquired orphaned gas utilities from conglomerates exiting the sector. It examines October 1, 2004, when the company doubled in size overnight by acquiring the Lone Star Gas system from a distressed TXU Corp — a transaction that delivered its primary asset base alongside long-term operational liabilities. It details the morning of February 23, 2018, at a residence on Espanola Drive in northwest Dallas, and the regulatory scrutiny that followed. It covers Winter Storm Uri, when a utility carrying $2 billion in pass-through fuel costs confronted the operational lag of cost recovery. The narrative then dissects the modern enterprise — its two operating segments, rate adjustment mechanisms, and peer metrics — before evaluating management execution, competitive moat frameworks, bull and bear cases, and long-term durability.
The central theme: Atmos has repeatedly converted operational liabilities into expanded rate base. While this demonstrates institutional execution, it primarily reflects an industry regulatory framework rather than an exclusive corporate moat — a distinction central to evaluating the business.
 Subscribe on LinkedIn
II. Origins & The Texas Panhandle Foundation (1906–1983)
The Panhandle gas field was discovered in 1918, and Amarillo Gas connected to it in 1920 — meaning the company that became Atmos spent its first fourteen years selling a synthetic product before switching to natural gas.7 That origin illustrates an enduring truth about the business: the core asset was never the fuel itself. The asset was the pipeline beneath the street and the legal franchise to keep it there.
The early decades brought consolidation under larger corporate owners. In 1924, Southwestern Development Company acquired both Amarillo Gas and Amarillo Oil.7 By 1954, these various gas properties were consolidated under Pioneer Natural Gas Company. Notably, in 1933 Pioneer began injecting odorant into its gas, four years before Texas made the practice mandatory statewide.7 Adding a distinct scent to an odorless, explosive fuel compressed the safety philosophy of the gas distribution industry into a single practice — one that would resurface with acute operational consequences in 2018.
Pioneer spent the postwar decades pursuing conglomerate diversification across coal mining, uranium, and tire retreading.7 By the late 1970s, it had grown into a billion-dollar enterprise where regulated gas distribution played the quiet role — capital-intensive, growth-constrained, and heavily regulated, positioned alongside volatile exploration and production divisions whose revenues swung with crude oil prices.
A corporate shift followed. In 1981, Pioneer organized its natural gas distribution operations into a subsidiary called Energas Company, and in 1983 spun it off as an independent, publicly traded entity.6 The strategic logic inverted the conglomerate playbook of prior decades: rather than housing a utility inside a conglomerate to smooth cyclical earnings, Pioneer separated the business because the two segments pursued divergent priorities. Exploration required capital flexibility and commodity risk, whereas the utility required a stable balance sheet, predictable dividend capacity, and dedicated regulatory focus.
Charles Vaughan became Energas's first president, inheriting modest internal expectations; contemporary accounts indicate Pioneer executives expected little growth from the standalone utility.6 The newly independent firm operated entirely within Texas, serving customer bases in West Texas towns dependent on boom-and-bust oil economies, with few immediate growth avenues beyond organic regional population gains.
This historical context challenges a common assumption about utility investing: that regulated gas distribution was an inherently safe, high-margin business from the outset. Before modern regulatory rate riders, a utility making capital investments in pipelines had to wait for formal general rate cases to recover costs — a lag measured in years rather than months. During the 1970s and early 1980s, that regulatory lag collided with double-digit inflation and soaring interest rates, allowing utilities to achieve authorized paper returns while suffering real economic erosion. Earnings were further exposed to weather volatility, as mild winters directly suppressed volumes without compensatory adjustments. Atmos only secured broad weather protection much later; by fiscal 2025, weather-normalization mechanisms across seven states covered approximately 97 percent of its residential and commercial revenue base.3
The fundamental lesson of this era was that utility profitability depends far less on the physical assets owned than on the regulatory rules governing them. Two distributors with identical pipelines in adjacent territories can yield starkly different returns depending on whether regulators grant annual capital investment trackers, weather-normalization formulas, and bad-debt recovery mechanisms. Atmos's post-1983 trajectory stems directly from internalizing this reality — paired with a strategic thesis that if organic infrastructure expansion was slow, corporate growth could be achieved by acquiring existing pipe.
III. The Energas Spinoff & The 18-Year Roll-Up Engine (1983–2003)
The name came first. In 1988, Energas rebranded itself Atmos Energy Corporation—derived from the Greek word for atmospheric gases—and listed its shares on the New York Stock Exchange under the ticker ATO.7 It was a small company with a big name, and the title was aspirational in the exact same way as its corporate strategy.
That strategy stemmed from a clear reading of market structure. Across the American South and Midwest during the 1980s and 1990s, natural gas distribution was fragmented and largely orphaned. Utility divisions sat inside diversified corporations—such as telecommunications firms, holding companies, and industrial conglomerates—that had lost interest in them. These divisions were chronically undercapitalized, operated on legacy billing systems, and relied on small regulatory teams that filed rate cases infrequently and defensively. To a buyer with a centralized corporate infrastructure, these were not operational turnarounds; they were utility assets that simply required systematic, professionalized management.
Atmos acquired them sequentially over roughly fifteen years. Trans Louisiana Gas arrived in 1986, adding about 69,000 customers and establishing the company's first footprint outside Texas.6 Western Kentucky Gas followed in 1987, adding roughly 150,000 customers.6 Greeley Gas Company joined in 1993, bringing about 100,000 customers across Colorado, Kansas, and Missouri.6 The 1997 merger with United Cities Gas Company proved transformative for the pre-2004 era, pushing Atmos past one million customers and expanding its footprint into Tennessee, Virginia, Georgia, and Illinois.6 In 2000, Atmos agreed to acquire the Louisiana operations of Citizens Utilities for about $375 million. The deal added roughly 279,000 customers, making Atmos the largest gas distributor in Louisiana and the fifth-largest pure gas utility in the United States, with 1.4 million customers.7 Mississippi Valley Gas followed in December 2002, funded in part by a 4.1-million-share equity offering that generated $99.2 million in net proceeds.9
Viewed purely as a summary list, this acquisition cadence resembles a seamless machine. In practice, it was not. The counter-evidence lies directly within the roll-up's largest deal.
United Cities Gas, founded in 1929, had itself been assembled piecemeal. What Atmos inherited in 1997 was not a single unified utility, but a patchwork of regional operations. Integration proved both tedious and expensive, hindered by incompatible computer systems and inconsistent billing workflows across more than one hundred scattered local service offices.6 Beginning in 1998, Atmos launched a multi-year Customer Service Initiative to consolidate those regional outposts into centralized customer support centers—including facilities in Amarillo and Waco that remain active today—while unifying billing systems and deploying mobile data terminals.63 The overhaul eventually lowered operating expenses and boosted earnings, but execution required years, explaining why the company's acquisition pace slowed markedly in the early 2000s.
A second, quieter piece of counter-evidence emerged over the following quarter-century: several properties acquired during this era were later divested. Atmos sold its Missouri, Illinois, and Iowa distribution assets to a Liberty Utilities affiliate of Algonquin Power in 2012. On April 1, 2013, it sold its Georgia distribution assets—representing roughly 64,000 meters—for about $155 million in net cash proceeds.21 Later, effective January 1, 2017, the company sold its nonregulated gas marketing arm, Atmos Energy Marketing, to a CenterPoint subsidiary for an all-cash price of $40 million plus working capital.20
Investors should view these divestitures not as corporate missteps, but as strategic pruning. Selling small, non-contiguous operations to concentrate capital in high-growth Texas markets represented a defensible reallocation. Furthermore, a $40 million marketing unit is negligible for an enterprise that currently spends that amount on capital projects in less than a week. Still, these sales bound the roll-up narrative: the strategy was not an unbroken record of disciplined value creation. Instead, it comprised fifteen years of acquiring available, fragmented utilities, followed by fifteen years of quietly shedding assets that no longer fit the long-term thesis. The resulting portfolio proved superior to the original collection of assets—a testament to operational refining rather than flawless initial targeting.
What this era ultimately produced was a core institutional capability far more valuable than any single transaction: a centralized corporate center adept at standardizing back-office operations and professionalizing regulatory filings. When Atmos later sought approval from eight state commissions for annual capital-recovery mechanisms, it drew on two decades of experience presenting frequent, meticulously prepared filings to regulatory bodies.
That capability was about to be tested at four times the scale.
IV. The TXU Gas Mega-Deal: The Transformative Bet on Lone Star Gas (2004)
By 2003, TXU Corp faced a balance-sheet crisis that had nothing to do with pipes in the ground. The former Texas Utilities had spent the deregulation years building an unregulated merchant energy business—including a costly European expansion—and urgently needed financial relief. Sitting inside the conglomerate was TXU Gas Company, the former Lone Star Gas. Founded in 1909, Lone Star had distributed natural gas across North Texas long before much of the Dallas–Fort Worth Metroplex developed into suburbia. It was a regulated, slow-growth, capital-intensive asset trapped inside a parent company seeking unregulated expansion.
On June 17, 2004, Atmos announced a definitive agreement to acquire substantially all of TXU Gas's operations for $1.925 billion in cash, without assuming any TXU Gas debt.8 The transaction included approximately 26,400 miles of distribution pipeline serving nearly 1.4 million customers across roughly 550 Texas cities and towns, alongside the intrastate transmission and storage network supplying them.8 For a company that had spent two decades expanding one hundred thousand customers at a time, the deal doubled Atmos's scale in a single step, bringing the combined customer count of the two Dallas-headquartered utilities to roughly 3.1 million.8
Subsequent commentary has often framed the transaction as Atmos securing a bargain from a forced seller. Securities filings reveal a more measured reality. Atmos's fiscal 2004 Form 10-K states plainly that "the sale of TXU Gas's assets was held through a competitive bid process."9 Atmos won an open auction rather than cornering a distressed counterparty. The auction produced a standard market valuation: against a final cash purchase price of $1.905 billion after closing adjustments, Atmos recorded net property, plant, and equipment of $1.496 billion alongside $465 million in goodwill and intangibles.9 Paying roughly 1.3 times net plant represented a fair outcome for a large, contiguous system during a period of elevated utility multiples, but it was not a distressed-asset valuation.
The deal's structure highlighted Atmos's disciplined approach to capital management. Management pre-funded equity ahead of closing: on July 19, 2004, the company sold 9,939,393 shares at $24.75 each, generating net proceeds of $235.7 million.9 Atmos closed the transaction on October 1, 2004, utilizing roughly $1.7 billion in commercial paper backstopped by a short-term bridge facility. Management refinanced that bridge facility rapidly, issuing $1.39 billion in senior unsecured notes on October 22 and selling an additional 16.1 million shares on October 27 for net proceeds of $382.5 million.9 In total, Atmos raised approximately $618 million in equity—funding nearly a third of the purchase price with stock inside four months—and promptly cancelled the bridge facility.
The strategic insight lay in conservative balance-sheet stewardship rather than complex financial engineering. Atmos bypassed the temptation common among leveraged acquirers—retaining heavy debt loads to protect share count while waiting for earnings growth—and instead diluted shareholders immediately to preserve investment-grade credit ratings. Twenty-two years later, that conservative financing model remains central to how Atmos converts infrastructure expansion into per-share earnings growth, a dynamic this analysis will examine in detail.
The most valuable asset in the acquisition was not its 1.4 million distribution customers, but its transmission network, which Atmos established as a dedicated operating division: Atmos Pipeline–Texas (APT). An intrastate pipeline in Texas occupies a distinct regulatory position, overseen by the Railroad Commission of Texas rather than federal authorities, while physically bridging the state's major producing basins and its largest metropolitan center. APT's footprint spans central, northern, and eastern Texas, connecting to or running near the Barnett Shale, the Texas Gulf Coast, and the Permian Basin, with interconnects at all three major Texas hubs—Waha, Katy, and Carthage.24 By fiscal 2025, the system transported roughly 904 billion cubic feet (Bcf) of natural gas, averaging about 2.5 Bcf per day.2
In 2004, the transaction was not driven by Permian Basin production. The Barnett Shale was only beginning to attract attention, and the Permian shale revival remained years away. APT's long-term strategic value emerged as an accidental benefit of energy geology: Atmos acquired a system originally constructed to supply Dallas, which two decades of domestic shale expansion transformed into a major toll road between prolific gas basins and rapidly growing urban demand centers.
However, the deal also introduced significant operational liabilities. Lone Star Gas had laid mains beneath North Texas neighborhoods starting in the 1910s, leaving Atmos with extensive networks of vintage bare steel and cast iron pipe beneath dense Dallas residential districts. While Atmos recorded $1.5 billion in net plant on its balance sheet, it simultaneously inherited a multi-decade infrastructure replacement burden that had not been fully priced into the transaction. The company would not fully confront that legacy obligation for another fourteen years—until a tragic 2018 house explosion forced a systemic re-evaluation of its pipeline infrastructure.
V. The Inflection Point: The 2018 Dallas Gas Leak Crisis & Integrity Pivot (2015–2020)
At 6:38 a.m. on Friday, February 23, 2018, a natural gas explosion destroyed a home at 3534 Espanola Drive in northwest Dallas. Twelve-year-old Linda "Michellita" Rogers was getting ready for a cheerleading competition and recording a video of herself fixing her hair when the blast occurred. She was killed, and four other family members were injured. When Dallas Fire-Rescue arrived six minutes later, first responders found major structural damage and no active fire.1012
What turns this incident from an isolated tragedy into an institutional case study is what had occurred on the same block over the preceding 48 hours. At 5:49 a.m. on February 21, an explosion at 3527 Durango Drive caused significant structural damage and left an occupant with second-degree burns. At 10:21 a.m. the following day, a near-identical blast struck 3515 Durango Drive, again causing severe structural damage and burning an occupant.10 Both residences were connected to the same natural gas main supplying Espanola Drive. Two gas-fueled explosions occurred on a single street on back-to-back days, followed by a fatal explosion on the third morning.
The National Transportation Safety Board adopted its final report on January 12, 2021. The agency's probable-cause finding laid out a multi-tiered sequence of institutional failures. The NTSB determined the explosion was caused by the ignition of natural gas leaking from a main "damaged during a sewer replacement project 23 years earlier and was undetected by Atmos Energy Corporation's investigation of two related natural gas incidents on the 2 days prior." Contributing factors included "Atmos Energy Corporation's insufficient wet weather leak investigation procedures," its "inaction to isolate the affected main and evacuate the houses," and "Atmos Energy Corporation's inadequate integrity management program."10
Those findings point directly to operational judgment rather than mischance. Following the second explosion, Atmos dispatched crews to the street, locating 13 leaks that posed an existing or probable future hazard. Yet, as the NTSB noted, "none of its employees questioned the integrity of the system."10 Technicians uncovered more than a dozen hazardous leaks along a single block but treated them as isolated maintenance tasks rather than systemic evidence that a 71-year-old main was failing. The report highlighted another critical detail: none of the residents in the affected homes smelled gas because the odorant added to detect leaks—the same safety innovation Pioneer began using in 1933—strips away as natural gas migrates through wet soil.10
The immediate operational response was massive. Atmos and local authorities evacuated approximately 300 single-family homes, 250 apartment units, and 600 students across four expanding exclusion zones.10 On March 1, 2018, Atmos notified customers of a planned outage to disconnect service to roughly 2,800 homes while crews replaced the system. The company publicly attributed the disruption to "recent extraordinary rains and unique geological conditions," asserting the step was not prompted by an imminent emergency.10 The NTSB cited a direct contradiction in the utility's messaging: in a July 2, 2018 filing with state regulators, Atmos acknowledged the outage was a direct response to the leak activity.10 Full service restoration across the neighborhood took more than two months, completing on May 11, 2018.10 Atmos replaced about 25 miles of pipe in northwest Dallas over the following months,11 while discovering an additional 740 hazardous leaks across the area in the weeks following the blast.10
Formal accountability followed two tracks. The Rogers family filed a wrongful-death lawsuit, settling with Atmos in 2019 for an undisclosed sum.13 In April 2021, the Railroad Commission of Texas proposed a $1.6 million fine—the largest enforcement penalty in the agency's history. The regulatory action cited four violations, including failure to maintain continuous surveillance of the Dallas distribution network, inadequate leak-detection training and procedures, and failure to evaluate gas migration after the initial two incidents.12 Local critics pointed out that a $1.6 million fine represented a trivial fraction for a utility that generated roughly $500 million in annual net income.12
The utility's primary long-term response was neither corporate PR nor extended litigation; it was massive capital deployment. Atmos redirected its capital allocation strategy toward replacing legacy infrastructure. By fiscal 2025, approximately 87 percent of its $3.6 billion capital budget went to safety and reliability projects.1 Its long-term capital plan targets replacing 5,500 to 6,000 miles of distribution mains by 2030—representing 6 to 8 percent of its total system—while reducing its inventory of vintage steel service lines from 647,000 in 2024 to between 500,000 and 530,000 by 2030.2 That reduction reflects an ongoing effort: the company's steel service line count stood at more than 1.16 million in 2012.2
The underlying economics highlight a unique feature of utility regulation. Replacing a vintage pipeline does not increase gas sales or open new customer markets. Instead, it expands the rate base—the total capital investment on which state commissions permit the utility to earn an authorized return. Atmos operates with a blended allowed return on equity of 9.8 percent across its distribution divisions, while Atmos Pipeline–Texas carries an allowed return of 11.45 percent.2 Consequently, every dollar invested in replacing an aging main enters the rate base to generate a regulated return of roughly 10 cents annually, funded through customer rates. System safety improvements and corporate earnings growth move in complete alignment.
While this alignment has fueled steady earnings growth, the model carries key analytical caveats. First, regulatory frameworks reward the total volume of capital deployed rather than the specific risk reduced per dollar spent. While safety priorities and capital spending frequently overlap, regulators must continuously monitor the distinction. Second, accelerated capital spending has not completely eliminated risk. Pipeline incidents have continued to occur near Atmos lines in North Texas since 2018, and the utility maintains ongoing leak-management responsibilities across a distribution network spanning roughly 76,000 miles of mains.2 The evidence indicates that Atmos was not operating a gold-standard integrity program prior to 2018, but subsequently established a heavily funded asset-replacement program. The long-term safety impact of that transition remains to be demonstrated across future operational cycles.
What arrived almost immediately was a different kind of stress test—one that had nothing to do with physical pipe and everything to do with cash liquidity.
VI. Stress-Testing the Monopoly: Winter Storm Uri & The $2.2 Billion Liquidity Crunch (2021–2023)
In the third week of February 2021, severe freezing temperatures across Texas knocked natural gas wellheads offline and caused widespread failure of the state's electric grid. Less visible, but equally consequential, was the financial strain placed on natural gas distributors obligated to keep fuel flowing to residential customers while gas supplies rapidly shrank and wholesale prices surged.
A gas utility facing extreme cold has virtually no operational discretion. Its legal obligation to serve requires continuous delivery, as depressurizing a distribution network in freezing weather creates a severe emergency requiring technicians to manually relight individual customer meters. To maintain system integrity, Atmos purchased gas at extraordinary market prices. State leaders in Texas and Kansas declared emergencies, while utility commissions urged distributors to maintain service. Over a single month, Atmos's aggregate natural gas purchases reached approximately $2.3 billion,14 which the company paid in full by the end of March 2021.
That single month of supply costs exceeded twice the utility's entire annual net income at the time, straining a balance sheet structured around the assumption that fuel expenses are pass-through line items. On March 9, 2021, Atmos issued $2.2 billion in debt securities to fund the purchases.14
Credit rating agencies responded quickly. S&P downgraded Atmos's long- and short-term debt ratings by one notch, moving them from A/A-1 to A-/A-2 with a negative outlook. Moody's affirmed its A1/P-1 rating but similarly shifted its outlook to negative.14 By May 2026, investor disclosures showed senior unsecured ratings of A2 from Moody's and A- from S&P,2 indicating that five years after the storm, the company had not recovered its pre-crisis credit standing. While a one-notch rating reduction does not threaten solvency, it permanently increased capital costs for a business model that relies on continuous equity and debt issuance to fund its capital budget.
Legislative action provided the mechanism for recovery. Texas enacted House Bill 1520 on June 16, 2021, authorizing the Railroad Commission of Texas to establish a statewide securitization framework under which the Texas Public Finance Authority could issue customer rate relief bonds on behalf of participating natural gas utilities.14[^15] Atmos filed on July 30, 2021, seeking to securitize $2.0 billion in extraordinary gas costs.14 On November 10, 2021, the Railroad Commission issued a final determination confirming that all of Atmos's gas and storage purchases during the storm were prudently incurred — eliminating the significant regulatory risk of cost disallowance.14 The Commission approved the final financing order on February 8, 2022, covering roughly $3.4 billion across Atmos, CenterPoint, Texas Gas Service, and five smaller utilities to protect more than 4 million residential and 260,000 commercial customers from sudden bill spikes.15
The securitization model shifted extraordinary costs into long-term customer financing. Under the statutory structure, a state entity issues long-dated bonds, uses the proceeds to reimburse the utility, and removes the liability from the company's balance sheet. Customers then repay the debt over multiple decades through a dedicated surcharge on monthly bills extending into the late 2030s. The securitized debt remains an obligation of the issuing authority rather than Atmos, and the designated customer surcharges are isolated from Atmos's corporate creditors.3 Kansas executed a smaller, parallel arrangement in June 2023, when Atmos Energy Kansas Securitization I, LLC issued $95 million in 5.155 percent securitized utility tariff bonds.3
Unwinding the cash mechanics in Texas required two years to complete. Atmos's fiscal 2023 cash flow statement recorded the resolution in three steps: drawing $2.02 billion in term loan proceeds, paying off the $2.2 billion in temporary Uri notes, and subsequently retiring the $2.02 billion term loan upon receiving the state securitization proceeds.3 The sequence effectively transferred a massive short-term liquidity burden off the utility's balance sheet and into the state-backed financing structure.
Winter Storm Uri challenged a foundational premise of utility investing: the assumption that wholesale commodity spikes do not affect gas distributors because fuel costs are pass-through expenses. While that principle holds true for the income statement over time, it breaks down on the balance sheet during acute market shocks. Between February 2021 and the receipt of securitization proceeds two years later, Atmos carried roughly $2.1 billion as a regulatory asset—effectively an unfunded receivable from future rate-payers—financed with market-rate debt that compressed its equity capitalization ratio and triggered credit downgrades.14 Pass-through mechanisms ensure ultimate cost recovery, but they do not provide immediate liquidity on the day wholesale invoices come due.
The episode demonstrated that Atmos's true operational backstop is political and regulatory alignment. The Texas legislature created a tailored securitization statute to preserve utility liquidity, and state regulators affirmed that emergency purchases were prudent. However, that reliance also underscores that regulatory goodwill—rather than physical distribution pipe—serves as the company's primary protective moat. Because political alignment can shift in response to future energy shocks or rising customer bill burdens, ongoing credit and equity performance will depend on whether future regulatory reviews grant rapid, full cost recovery as consistently as they did following the 2021 storm.
VII. Segment Deep-Dive & Modern Operations: Distribution vs. Atmos Pipeline-Texas (APT)
Strip away 120 years of narrative and Atmos today is two businesses stapled together by geography. One sells the last mile. The other owns the road that feeds it. Understanding how the earnings split between them has changed is the single most useful correction an investor can make to the standard description of this company.
The distribution segment is the one everyone pictures: roughly 3.4 million meters across six divisions in eight states, served through approximately 76,000 miles of distribution and transmission mains.24 It is heavily Texan. The Mid-Tex division alone accounts for about 1.83 million meters across 550 communities including the Dallas–Fort Worth Metroplex; add West Texas and roughly 65 percent of distribution rate base sits in Texas.32 The rest is spread across Louisiana (about 361,000 meters), Mississippi (250,000), Kentucky/Mid-States (Kentucky, Tennessee and Virginia, together about 364,000), and Colorado-Kansas (about 271,000).3 Distribution rate base was roughly $16.0 billion as of September 30, 2025, and the segment produced 62 percent of consolidated net income in fiscal 2025.2
The pipeline and storage segment is APT plus a 21-mile transmission line in Louisiana. Roughly 5,700 miles of intrastate pipeline, five underground storage facilities with about 53 Bcf of working capacity, 48 compressors, and around 700 city gate meters.42 Rate base: approximately $5.4 billion. Share of fiscal 2025 consolidated net income: approximately 36 percent.2
That last number deserves emphasis because it contradicts how Atmos is usually described. A segment holding a quarter of the rate base is generating well over a third of the earnings, and in the nine months ended June 30, 2026, it delivered $431.6 million of net income against $1,227.6 million consolidated — roughly 35 percent.4 Management's own fiscal 2026 estimate puts the business mix at about 62 percent distribution and 38 percent pipeline and storage.2 Atmos is not primarily a residential meter company that happens to own a pipeline. It is closer to a 60/40 blend of a monopoly LDC and a regulated intrastate transmission system.
Why does APT earn so much on so little rate base? Two reasons. Its allowed return on equity is 11.45 percent against 9.8 percent for the distribution divisions — a genuinely unusual spread that reflects the Railroad Commission's treatment of intrastate pipelines.2 And a meaningful slice of APT's income does not come from rate base at all.
This is the "through-system" business, and it is the least-understood line in Atmos's earnings. APT is allowed to move third-party gas across its system and capture the price difference between Texas hubs — the spread between, say, Waha in the Permian and Katy on the Gulf Coast. When Permian production outruns the pipelines available to move it out of the basin, Waha gas gets cheap, sometimes negatively priced, and anyone with spare capacity heading east earns a wide margin. This is not a regulated return on invested capital. It is a commodity spread business sitting inside a regulated utility, sharing its upside with customers through a benchmark mechanism.
In fiscal 2026 it was very good. Through-system activities added $33.8 million to APT operating income over nine months, and management said spreads averaged $4.66 in that period versus $1.77 a year earlier.45 And then, on the August 6, 2026 third-quarter call, it stopped being good. CFO Christopher Forsythe told analysts that "spreads have narrowed significantly" after new takeaway capacity came online — two pipelines entering service in late June and July, ahead of schedule — and guided the fourth-quarter through-system contribution to the low end of a previously indicated $0.08 to $0.12 range.527 The macro backdrop supports the explanation: more than 66 percent of new US pipeline capacity additions in 2026 and 2027, roughly 29.7 Bcf/d, originate in Texas, much of it aimed at debottlenecking Waha.26
The analytical conclusion is straightforward and slightly unflattering: a portion of Atmos's recent earnings growth is a basis-spread trade whose profitability depends on Permian takeaway capacity remaining scarce, and that scarcity is actively being competed away by other people's capital. It is not large enough to break the thesis — the $0.08–$0.12 range is roughly 1 percent of full-year EPS — but it is exactly the kind of item that flatters a growth rate on the way up and creates an awkward comparison on the way down. Investors reading a 20 percent year-over-year net income increase should know which parts recur.
The other thing every investor should know about fiscal 2026's growth is legislative. On June 20, 2025, Texas House Bill 4384 took effect, creating a new provision in the Utilities Code that lets a gas utility book certain costs on newly in-service plant into a regulatory asset for recovery through an interim rate adjustment.22 In plain terms: costs that previously hit the income statement while the utility waited for rates now sit on the balance sheet until they are recovered. For the nine months ended June 30, 2026, that legislation favorably affected Atmos's results by $132.4 million — roughly eleven percent of net income.4 On the third-quarter call, Jefferies' Julien Dumoulin-Smith asked directly whether this was sustainable. Forsythe's answer was candid: it represented "a step year change" in fiscal 2026, after which growth returns to the historical 6 to 8 percent EPS range.27 Management is telling investors, correctly, that a chunk of this year's growth does not repeat.
Set against that, the recurring engine is the rate machinery itself, and it is formidable. Atmos operates a different mechanism in nearly every jurisdiction, and the names matter less than the shared design: get capital into rates without a full rate case. In Texas, GRIP — the Gas Reliability Infrastructure Program — lets the company file annually to add the prior calendar year's net plant investment to rates; APT's February 13, 2026 GRIP filing requested $112.2 million of additional operating income and was approved by the Railroad Commission on May 12, 2026, a turnaround of under three months.4 The Dallas Annual Rate Review does the same job for the city of Dallas, formula rate mechanisms and rate review mechanisms cover the Mid-Tex cities, West Texas, Louisiana, Mississippi and Tennessee, and infrastructure riders cover Kansas, Kentucky and Virginia.3 Weather normalization in seven states neutralizes roughly 97 percent of residential and commercial weather risk; bad-debt riders in six states let the company recover the gas-cost portion of write-offs on about 89 percent of that revenue.3
The cumulative output of that machinery is the number to watch. In the nine months ended June 30, 2026, Atmos implemented regulatory actions worth $355.0 million of additional annual operating income and had a further $373.4 million pending — including a $273.2 million Mid-Tex Cities formula rate filing.4 For the full fiscal 2025 year the figure implemented was $333.6 million.1
It is also where the opposition lives. In August 2026, the Atmos Cities Steering Committee's consultants concluded that a $291.1 million Mid-Tex request should be $253.4 million; the parties settled at $260.5 million.18 ACSC states it has removed at least $369 million annually from proposed system-wide rate increases since 2008, and it is openly critical of GRIP's design, arguing the mechanism grants increases "even if the company's overall expenditures are declining, even if its revenues are increasing or even if the company is earning windfall profits," and that the Railroad Commission approves them as ministerial acts without input from cities or customers.17 That is an advocacy position, not a finding. But the existence of a well-funded, technically competent, 150-city permanent counterparty is a structural feature of Atmos's business, and it has been shaving tens of millions off requests for nearly two decades.
Against peers, the differentiation is narrower than it first appears. Atmos targets rate base growing from $21.4 billion at fiscal 2025 to $42.0 billion by fiscal 2030 — a compound rate around 14 percent.2 ONE Gas guides to 7 to 9 percent average rate base growth through 2030; NiSource to 8 to 10 percent on its base plan; Spire to roughly 7 to 7.5 percent in its major jurisdictions.232425 Atmos grows rate base nearly twice as fast as any of them. And yet its EPS growth target — 6 to 8 percent — is identical to NiSource's and only modestly above ONE Gas's 5 to 7 percent.22324 That gap between rate base growth and per-share earnings growth is not an accounting quirk. It is the price of the funding model, and it is the subject of the next section.
VIII. Current Management, Governance & Capital Allocation Architecture
J. Kevin Akers is an unusual utility chief executive in one respect: he did not come from finance, law, or a Wall Street-facing role. He ran divisions. He was president of Atmos's Mississippi Division from 2002 to 2007, then president of the Kentucky/Mid-States Division from May 2007 to October 2016, then Senior Vice President for Safety and Enterprise Services from January 2017 to October 2018 — a role created in the immediate aftermath of the Dallas explosion — then Executive Vice President, and then President and CEO in October 2019.28 Roughly three decades inside the company, with the two years before his elevation spent on safety.
That sequencing is the most informative fact about his tenure. The board did not hire a growth CEO after 2018. It promoted the person who had been given the safety portfolio, which is a reasonable proxy for what the board decided the job was. Akers's public register is correspondingly narrow: on earnings calls he returns repeatedly to operating metrics, customer growth counts, line-locate volumes and affordability comparisons, and he rarely ventures into strategic speculation. On the third-quarter fiscal 2026 call, asked about rising operating costs, his answer was operational rather than financial — "ongoing activity across the metroplex" tied to growth.27
Christopher T. Forsythe, Senior Vice President and Chief Financial Officer since February 2017, joined Atmos in 2003 and served as Vice President and Controller from 2009.28 He is the architect of the funding structure, and his signature is the systematic use of forward equity sale agreements — pre-selling stock at a price today for settlement months later. As of June 30, 2026, Atmos had $936.8 million of available proceeds from outstanding forward sale agreements and $506.5 million remaining under a $1.7 billion at-the-market equity program, sitting inside $4.6 billion of total liquidity.4 The March 2026 investor materials disclose a forward share price of $142.90 on contracts maturing between June 2026 and March 2027.2 The point of this apparatus is to remove timing risk: Atmos knows the price at which its future equity is sold before it spends the capital that equity funds.
Now the governance facts that matter, including one that cuts against the company's own narrative.
Atmos's short-term incentive plan is measured on a single metric: earnings per share. The compensation committee's stated view is that EPS "most accurately reflects the growth and performance of our operations."19 Long-term incentives are 75 percent performance-based restricted stock units measured on cumulative EPS over three fiscal years, and 25 percent time-based units; total shareholder return appears only as a limiter, capping payouts at target if TSR is negative.19 There is no safety metric, no leak-rate metric, no third-party damage metric in the formula. For a company whose entire strategic identity since 2018 has been safety, and whose capital plan is justified by safety, that is a genuine governance gap and the first thing a skeptical investor should raise with the board.
To the committee's credit, it demonstrated discipline where it counted. Fiscal 2025 actual EPS of $7.46 would have earned 186 percent of target. But HB 4384 and a companion bill had added roughly $27 million of pre-tax income, or $0.12 per diluted share, that had nothing to do with management performance. The committee adjusted the measured result down to $7.34, producing a 153 percent payout instead.19 Voluntarily stripping a legislative windfall out of your own bonus calculation is not standard practice, and it is real evidence about how this board behaves. The committee also raised the CEO's share ownership requirement from five times base salary to seven times in fiscal 2025.19 Akers's fiscal 2025 total compensation was $9,953,274, a ratio of 106 to 1 against a median employee at $94,123.19 Say-on-pay support exceeded 92 percent in 2025.19 Ernst & Young has served as auditor since 1983.3
The capital allocation architecture is where the story either works or does not. The plan is approximately $26 billion of capital between fiscal 2026 and 2030, with more than 80 percent dedicated to safety and reliability — about $4.2 billion in fiscal 2026 alone, of which management says 87 percent goes to distribution, transmission and storage safety.45 Roughly $6 billion of that total is earmarked for APT.2 Operating cash flow does not come close to covering it: for the nine months ended June 30, 2026, operations produced $1.67 billion against $3.08 billion of capital expenditures.4 The gap is filled with debt and equity, and in those nine months Atmos completed approximately $2.2 billion of long-term debt and equity financing.4
Here is the arithmetic that every Atmos investor should carry in their head. Diluted weighted-average shares went from 145.2 million in fiscal 2023 to 152.7 million in fiscal 2024 to 160.6 million in fiscal 2025.3 Net income over those two years rose 35 percent, from $885.9 million to $1,198.8 million. Diluted EPS rose 22 percent, from $6.10 to $7.46.3 The 13-point gap is dilution. It is not a failure — it is the deliberate consequence of funding a 14 percent rate base growth plan while maintaining an equity capitalization ratio near 60 percent and A-range ratings.4 But it is why a company growing rate base at 14 percent guides EPS to 6 to 8 percent, and it is the reason the popular framing of Atmos as a "13-15 percent compounding machine" is wrong at the per-share level, which is the only level that matters to an owner.
The claim that equity issuance is automatically accretive because shares are sold above book value deserves a harder look than it usually gets. Issuing above book does add to book value per share. Whether it adds to earnings per share depends on whether the incremental capital earns more than the earnings yield investors demand — a condition that holds comfortably when the stock trades at a healthy premium and fast rate recovery is intact, and that erodes quickly if either the multiple compresses or a jurisdiction slows recovery. The mechanism is real but conditional, and management's own 6 to 8 percent guidance is the honest expression of where the net lands.
One more capital allocation datapoint worth flagging as a question rather than a verdict: the indicated fiscal 2026 annual dividend rose 14.9 percent to $4.00 per share, against a stated 6 to 8 percent dividend growth target and a fiscal 2025 increase of 8.1 percent.23 A 42-year streak of increases is a genuinely rare artifact of consistency. A step-change nearly double the stated target, in the same year a legislative accounting change added eleven percent to net income, is a choice worth watching — either the payout ratio is being permanently reset higher, or the comparison base for fiscal 2027's increase has just become harder.
IX. Competitive Moat & Strategic Framework: 7 Powers & Porter's 5 Forces
Utility investing has a peculiar hazard: the industry's structural protections are so obvious that analysts stop interrogating them. Everyone knows a gas utility is a monopoly. Far fewer can define precisely what the monopoly consists of, who grants it, under what terms, and what forces could cause it to erode. Running Atmos through two standard competitive frameworks clarifies which advantages are genuinely company-specific and which simply reflect the industry's regulatory environment.
Start with Hamilton Helmer's concept of a cornered resource. The primary candidate is Atmos Pipeline–Texas (APT): 5,700 miles of intrastate transmission with rights-of-way threading through central and north Texas directly into the Dallas–Fort Worth Metroplex. Rebuilding that easement network through dense suburbs such as Plano and Arlington in 2026 is cost-prohibitive. However, that resource is cornered only for its primary function — transporting natural gas to Mid-Tex and other local distribution companies under Railroad Commission of Texas tariffs, where APT derives the bulk of its regulated revenue.2 The moment APT steps outside that role to compete for merchant through-system volumes, it becomes one pipeline among many. Market conditions in 2026 provided proof: new Texas takeaway capacity entering service compressed the basis spreads APT had been capturing, as roughly 29.7 billion cubic feet per day of takeaway capacity additions originated in Texas across 2026 and 2027.2627 The cornered resource is real for the regulated franchise, but absent for the commodity spread trade — meaning investors should value those two income streams at distinct multiples.
Scale economies represent the second candidate, though the evidence is subtle. Atmos spreads its corporate center, control systems, procurement, and regulatory apparatus across roughly 3.4 million meters, with fiscal 2026 operating and maintenance (O&M) expenses guided to between $875 million and $885 million.5 That translates to roughly $260 per meter annually across the enterprise. Scale in natural gas distribution yields limited field efficiency, which remains bound by local labor and geography; instead, its primary benefit is regulatory capacity. Scale allows Atmos to manage ten complex regulatory proceedings simultaneously across eight states with a dedicated internal team, whereas a smaller utility serving 200,000 customers must file rate cases infrequently using external consultants. That regulatory scale creates a compounding operational advantage, as insights from each filing inform subsequent proceedings.
Switching costs warrant skepticism. The conventional thesis holds that residential customers cannot transition away from natural gas without replacing furnaces, water heaters, ranges, and electrical panels — a multi-thousand-dollar retrofit few homeowners voluntarily undertake. That dynamic applies to existing housing stock, explaining why customer counts decline slowly even in municipal jurisdictions with electrification mandates. However, the critical growth margin lies in new construction. Every residential build in the Metroplex represents an initial choice by real estate developers evaluating building codes, utility incentives, and appliance economics rather than homeowners facing retrofit costs. Atmos notes in its affordability materials that residential gas costs run 2 to 4 percent below electricity on a household basis and account for roughly 1 to 1.2 percent of average customer wallet share versus 2 to 3 percent for electricity.5 That represents an economic price advantage rather than structural customer lock-in, and price differentials can shift over time.
Process power — the institutional execution of annual rate filings — represents Atmos's strongest capability, though the concept is frequently mischaracterized. The utility demonstrates high filing efficiency: an APT infrastructure filing requesting $112.2 million moved from submission in February 2026 to approval in May 2026, and management reports that over 90 percent of annual capital begins earning a return within six months.42 However, statutory mechanisms like Texas's Gas Reliability Infrastructure Program (GRIP) are available to all gas utilities state-wide, and formula rate riders exist across multiple jurisdictions by commission order. Atmos executes within these mechanisms efficiently, but it does not own the underlying regulatory statutes. The company possesses a durable operational execution edge inside a shared regulatory framework — a valuable capability that nevertheless remains subject to legislative revision.
Counter-positioning, another power frequently cited in bull cases, does not apply under standard strategy definitions. Counter-positioning requires that incumbent competitors cannot replicate a newcomer's business model without damaging their core business. Nothing prevents a diversified utility from managing its gas distribution division efficiently, and several do. Atmos's pure-play focus represents a strategic portfolio choice that offers undivided management focus, a straightforward equity narrative, and freedom from renewable-generation write-downs, but it does not constitute a structural competitive barrier.
Applying Michael Porter's Five Forces framework highlights a distinct dynamic regarding buyer power.
Threat of new entrants remains near zero, though not primarily due to legal monopolies. Atmos's fiscal 2025 Form 10-K specifies that the utility "operates in our service areas under terms of non-exclusive franchise agreements granted by the various cities and towns that we serve," holding 1,010 local franchises at September 30, 2025, with terms generally ranging from five to 35 years that expire and renew periodically.3 The legal barrier is less absolute than an exclusive franchise implies. Entry is prevented primarily by physical asset economics: competing operators will not duplicate parallel gas mains beneath established municipal streets. While municipalization remains a theoretical risk, the process is capital-intensive and slow, serving primarily as a negotiating lever for municipal authorities.
Bargaining power of buyers is traditionally rated low because individual households cannot select an alternative gas distributor. Individually, retail customers are captive; collectively, they exercise structured bargaining power. The Atmos Cities Steering Committee (ACSC) functions as an organized, technically staffed counterparty that intervenes in major Texas proceedings, contests interim rate adjustments, and negotiates rate settlements. ACSC reports that its interventions have removed at least $369 million from proposed system-wide rate increases since 2008,17 while its August 2026 settlement of a Mid-Tex rate filing reduced the utility's requested increase by roughly $31 million.18 Atmos does not face traditional customer churn; it faces continuous regulatory and municipal litigation, which directly shapes authorized rates of return.
Bargaining power of suppliers is low regarding wholesale natural gas, as purchased gas adjustment clauses pass commodity costs directly to customers, leaving distribution operating income neutral to fuel prices.3 However, supplier pressure is higher regarding capital inputs and labor. Management increased its fiscal 2026 O&M guidance by roughly $10 million, citing higher compliance, safety, and line-locate activity, while projecting annual O&M inflation of approximately 4 percent going forward.527 Company disclosures note that the overall execution of the capital budget may be impacted by rising labor and materials costs.4 For a business model reliant on converting capital expenditure into rate base, the cost of steel pipe and specialized labor is a key financial variable.
Threat of substitutes represents a long-term risk that moves slowly and varies by region. Rivalry within territory is absent due to physical distribution economics. However, the utility faces an external form of competition omitted by traditional industry models: competition for investment capital. A utility requiring roughly $1 billion in annual equity issuance competes continuously across broader capital markets for yield-oriented investors. The resulting cost of equity capital — rather than local market position — determines whether ongoing rate-base expansion generates per-share earnings growth.
In sum, Atmos's structural advantages are significant, layered, and largely derived from external regulatory frameworks. Its proprietary advantage lies in operational execution — specifically its capital deployment speed, regulatory filing machinery, and conservative equity funding architecture. The remainder stems from utility market structure, which Atmos inhabits as a dedicated pure-play enterprise.
X. Analysis & Investment Case: Bull vs. Bear & Skeptical Stress Test
The bull case for Atmos rests on three testable premises.
First, demographics. Roughly 65 percent of distribution rate base sits in Texas, where the company added nearly 51,000 customers in the twelve months ended June 30, 2026, including approximately 39,000 in Texas.25 On the third-quarter earnings call, management attributed this expanding customer base to ongoing corporate relocations into the state.5 Unlike utilities facing flat or shrinking customer bases, Atmos secures organic volume growth as new meters connect to existing mains — deploying high-return capital into already established fixed networks. This geographic growth driver is durable because it relies on regional population migration outside management's direct control.
Second, the capital deployment pipeline. If executed and fully recovered, the $26 billion capital plan increases rate base from $21.4 billion to $42.0 billion by fiscal 2030, supporting management's target of $10.80 to $11.20 of earnings per share in that year.2 The plan's credibility rests on rapid cost recovery mechanisms and a record of meeting financial targets. Fiscal 2025 diluted earnings per share reached $7.46, matching guidance initiated at the prior year's close, while fiscal 2026 guidance was raised during the year to $8.40–$8.50 and reaffirmed in August.15
Third, regulatory constructiveness. Management characterizes 96 percent of rate base as sitting in states with policy support for gas infrastructure investment.2 The Texas legislature has twice intervened in the industry's favor over five years, enacting securitization under House Bill 1520 in 2021 and interim expense deferral under House Bill 4384 in 2025.
Countering this bullish thesis is a skeptical stress test focused on key analytical vulnerabilities.
The dilution gap represents the sharpest structural critique. Comparing rate base expansion with per-share earnings growth reveals why shareholders capture only a portion of asset expansion: a 14 percent rate base compound annual growth rate converts into 6 to 8 percent annual EPS growth. Management defends this gap as the cost of maintaining an A-range credit rating, arguing that higher leverage would raise debt service costs and imperil regulatory recovery frameworks. That defense is economically sound, but it leaves the equity thesis dependent on shares trading at a valuation premium that keeps equity issuance non-dilutive. If market multiples compress, funding capital requirements becomes more costly just as spending cannot be paused, given that the underlying investments are safety-driven and non-discretionary.
Affordability presents a secondary constraint where bullish and bearish arguments converge on customer bill impacts. Because rate base additions translate directly into higher monthly charges, capital spending creates consumer headwinds. The Atmos Cities Steering Committee projects average monthly residential bills in its Texas footprint rising from roughly $80 in 2025 to roughly $121 by 2030 — a more-than-50-percent increase — and the coalition opposed House Bill 4384 specifically on bill-impact grounds.16 Management's counter is the wallet-share comparison against electricity.5 Both observations reflect real conditions. The unresolved question is political rather than mathematical: at what bill threshold do Texas municipalities and the Railroad Commission resist further interim rate adjustments? This constraint remains untested at a $42 billion rate base.
Interest rate exposure creates a quiet cost-of-capital squeeze. Atmos carried roughly $10.3 billion of long-term debt including current maturities at June 30, 2026, within total capitalization of $25.1 billion, with a weighted average maturity of about 17.2 years.42 That long maturity profile prevents immediate refinancing cliffs. Instead, financial pressure manifests gradually: authorized returns on equity near 9.8 percent were established during lower-rate environments. If debt and equity costs remain elevated while allowed returns stay fixed, the net earned spread narrows across the capital base. Resolving that compression requires filing full general rate cases — proceedings that reopen utility cost structures to municipal challenge.
Governance structures reflect an alignment mismatch. Compensation disclosures reveal no safety, leak-reduction, or damage-prevention metrics in executive incentive plans, despite management's strategic focus on infrastructure safety. Instead, short-term and long-term incentives depend entirely on earnings per share. While an EPS-focused compensation model incentivizes capital deployment, it creates a potential governance gap at a utility justifying capital spending on safety grounds. The compensation committee demonstrated discipline by deducting the $0.12 per share House Bill 4384 legislative windfall from fiscal 2025 bonus calculations, yet that adjustment addressed a one-time accounting gain rather than executive metric design.
The claim that energy transition optionality provides future upside is unsupported by company disclosures. In the fiscal 2025 Form 10-K, renewable natural gas and hydrogen do not appear as revenue drivers or capital plan components; the substantive greenhouse-gas discussion appears in risk factors, describing the possibility that regulation may require the adoption of new infrastructure or technology.3 The $26 billion plan is described in the same filing as more than 80 percent safety and reliability spending on conventional distribution and transmission modernization.4 These disclosures indicate that Atmos functions as a conventional pipe replacement and regional customer growth story. Any decarbonization optionality carries no value for investors until specific projects enter state capital plans under approved rate base treatment.
Quality of earnings considerations suggest headline growth will moderate. Two items in fiscal 2026 flatter the growth rate and neither recurs at the same magnitude: the $132.4 million legislative benefit through nine months, which the CFO characterized as a step-year change, and the APT through-system spread income, which management has already guided lower.427 Because underlying earnings growth trails reported headline figures, investors should evaluate the fiscal 2027 guidance carefully when the five-year plan is refreshed in the autumn.27
Evaluating Atmos's long-term trajectory requires tracking three key performance indicators rather than quarterly earnings fluctuations:
- Annualized operating income from implemented regulatory outcomes. This metric measures regulatory cost recovery efficiency, showing $333.6 million implemented in fiscal 2025, $355.0 million implemented through nine months of fiscal 2026 with $373.4 million pending.14 If rate implementation keeps pace with capital outlays, the regulatory model remains intact; if implementation lags, regulatory friction is expanding.
- Rate base per diluted share. Comparing rate base expansion against share count growth measures net per-share value creation, testing whether equity funding preserves owner economics.
- The average residential bill in the Texas footprint. This metric defines the political boundary of the capital plan, determining customer opposition levels, municipal intervention intensity, and the durability of Texas's regulatory alignment.
The overall calibration: historical evidence leaves the core investment claim intact but narrowed. Atmos is a superior operator of a regulated gas platform in constructive jurisdictions, with a proven record of converting capital into recovered rate base. However, it does not compound per-share earnings at double-digit rates, remains vulnerable to liquidity shocks during commodity spikes, and relies on a protective moat consisting of state statutes and regulatory practices subject to ongoing political calibration.
XI. Playbook: Core Business & Investing Lessons
Strip Atmos down to transferable lessons and four survive contact with the evidence.
Owning the asset is worth less than owning the recovery mechanism. This is the central lesson of the company's 120-year history, demonstrated twice over. Before modern trackers existed, a utility deployed capital and waited years to earn a return on it, allowing inflation to quietly erode purchasing power. Today, management reports that more than 90 percent of Atmos's capital begins earning a return within six months; the difference between those two regimes is the difference between a bond proxy and a compounder.2 The principle applies broadly beyond utilities: in any regulated or contracted industry, the terms governing capital recovery matter more than the quality of the physical assets themselves. Two operators with identical infrastructure and different tariff mechanics will yield vastly different returns. The inverse warning also holds: a business deploying capital aggressively without rapid recovery mechanisms destroys real economic value while reporting nominal growth.
Crisis can be converted into capital deployment, but the conversion carries moral hazard. Atmos's primary response to the 2018 Dallas explosion was not defensive litigation, but the largest sustained pipe-replacement program in its history. Because regulators allow an authorized return on that infrastructure spending, an operationally necessary remediation also proved financially rewarding. That alignment is rare — most companies facing a safety crisis must balance remediation costs against shareholder returns. However, an objective reading highlights the underlying incentive: when infrastructure replacement earns an allowed return on equity near 9.8 percent in perpetuity, the incentive to define safety projects broadly becomes permanent. Systemic discipline must come from regulators and intervening municipal groups rather than internal capital allocation instincts. Investors should view organized municipal opposition not as a fundamental threat to the business model, but as essential quality control.
Focus prevented a conglomerate discount — but focus resulted from a long cleanup rather than original design. The pure-play identity Atmos emphasizes today was assembled by subtraction: selling its Missouri, Illinois, and Iowa distribution systems in 2012, its Georgia assets in 2013, and exiting its nonregulated marketing division in early 2017.2120 The company that entered 2017 as a fully regulated pure-play utility had spent fifteen years shedding assets accumulated during the prior fifteen years. The strategic lesson is not simply to operate as a pure play, but that portfolio coherence is typically achieved through disciplined divestitures rather than flawless initial construction. The willingness to sell viable assets that no longer fit a core thesis is rarer — and often more valuable — than the appetite for acquisitions.
Infrastructure compounding requires demographic tailwinds that cannot be manufactured. The Atmos model relies on operating in regions experiencing population and business growth. Adding tens of thousands of customer meters annually to an existing network represents the lowest-cost expansion in the gas distribution industry, helping offset fixed-cost inflation that pressures utilities in stagnant territories.5 For investors evaluating infrastructure compounders, the key variable is customer growth: a rate base expanding at 14 percent annually in a declining population center creates an unsustainable bill-increase cycle that inevitably triggers regulatory pushback. While Atmos's heavy Texas footprint is occasionally cited as a geographic concentration risk, empirical evidence suggests that concentration is central to its growth engine.
A fifth observation serves as a caution regarding how utility narratives are framed. Trackers like 24 consecutive years of earnings-per-share growth and 42 consecutive years of dividend increases often invite the assumption of an unassailable business model.2 The historical record reveals a more contingent reality: a company that sustained a one-notch credit rating downgrade it has yet to recover, required tailored state legislation to absorb a single month of extraordinary gas costs during Winter Storm Uri, and realized a material portion of its fiscal 2026 growth from deferred accounting legislation passed in 2025. Consistent financial outcomes do not imply an absence of operational risk; frequently, they indicate that risk has been shifted off the income statement and onto regulatory and balance-sheet mechanisms.
XII. Epilogue: The Future of Natural Gas Infrastructure & Decarbonization Realism
Management's financial targets through the end of the decade provide clear benchmarks for evaluating execution. Fiscal 2025 closed with diluted earnings per share of $7.46, and management raised and reaffirmed fiscal 2026 guidance to between $8.40 and $8.50 on its August 6, 2026 earnings call. By fiscal 2030, the company targets diluted earnings per share of $10.80 to $11.20, supported by approximately $4.2 billion in annual capital expenditures and a plan to double its rate base.125 Achieving those projections requires no new business lines, speculative technologies, or large-scale acquisitions. The trajectory relies on continued pipeline replacement, timely regulatory filings, and ongoing access to capital markets on manageable terms over the next four years.
The political environment in Texas provides explicit statutory protection for natural gas infrastructure. Enacted in 2021, Texas House Bill 17 prohibited municipalities from restricting or discriminating against utility connections based on energy source — a measure prompted by municipal gas bans elsewhere and reinforced following the February 2021 blackouts.29 For Atmos, which relies on new residential and commercial construction to drive customer additions, the law preempts municipal building electrification mandates within its primary market. However, statutory preemption carries clear analytical boundaries. While the statute eliminates local municipal bans, it does not alter underlying consumer appliance economics, federal energy efficiency standards, developer choices, or policy frameworks in the seven other states where roughly a third of Atmos's distribution rate base resides.
From a strategic perspective, three operational priorities emerge from empirical evidence rather than corporate ambition.
The first priority is front-loading infrastructure replacement before reaching customer affordability constraints. The primary long-term limit on the business model is neither engineering capacity nor regulatory approval, but customer bill growth, which compounds alongside rate base expansion. Accelerating vintage steel and cast-iron pipeline replacement while customer bill headroom remains — supported by lower household gas costs relative to electricity and a favorable state regulatory climate — optimizes rate base expansion compared to pacing capital expenditures merely to smooth short-term reported earnings.
The second priority is maintaining discipline regarding asset acquisitions. As multi-utilities divest natural gas distribution assets to fund electric grid capital requirements, Atmos may encounter acquisition opportunities. However, historical execution favors restraint. The company spent more than a decade divesting non-core distribution assets to concentrate operations in high-growth, constructive regulatory jurisdictions. Acquiring utilities in states with slower regulatory cost-recovery mechanisms would dilute the operational focus and rapid capital recovery that underpin its valuation.
The third priority involves clarifying the utility's exposure to expanding industrial and power generation demand. Atmos Pipeline–Texas supplies electric generation facilities alongside local distribution companies, and management reported adding twelve new industrial pipeline customers expected to consume approximately 950,000 thousand cubic feet (Mcf) of gas annually — an increment management equated to roughly 18,000 residential meters.45 Although Texas is experiencing rapid expansion in data center development and gas-fired power generation, management did not highlight data center demand during its fiscal 2026 third-quarter earnings call, nor did analysts query the topic — contrasting with industry peers like NiSource that have positioned power generation demand prominently in their growth strategies.2724 Whether this silence reflects conservative guidance or limited commercial exposure remains a key item for future investor evaluation.
This dynamic returns to the fundamental model established when J.C. and Frank Storm began laying pipe in Amarillo in 1906. Atmos does not produce the commodity it delivers, set retail commodity prices, select its customer base, or expand service territories without regulatory authorization. Operating income depends entirely on state regulatory commissions permitting an authorized return on invested capital in exchange for delivering natural gas to 3.4 million customer meters. That regulatory framework has generated decades of predictable financial growth, but it remains a legal compact subject to ongoing public policy. The physical pipeline infrastructure beneath municipal streets is permanent; the regulatory permission to earn a return on it is renewed one filing at a time.
References
-
Atmos Energy Corporation Reports Earnings for Fiscal 2025; Initiates Fiscal 2026 Guidance; Raises Dividend — Atmos Energy Corporation, 2025-11-05 ↩↩↩↩↩↩
-
Analyst Update, May 2026 — Atmos Energy Corporation, 2026-05-15 ↩↩↩↩↩↩↩↩↩↩↩↩↩↩↩↩↩↩↩↩↩↩↩↩↩↩↩↩↩↩
-
Atmos Energy Corporation Form 10-K for the fiscal year ended September 30, 2025 — U.S. Securities and Exchange Commission, 2025-11-14 ↩↩↩↩↩↩↩↩↩↩↩↩↩↩↩↩
-
Atmos Energy Corporation Form 10-Q for the quarterly period ended June 30, 2026 — U.S. Securities and Exchange Commission, 2026-08-05 ↩↩↩↩↩↩↩↩↩↩↩↩↩↩↩↩↩↩↩↩↩
-
Atmos Energy (ATO) Q3 2026 Earnings Call Transcript — The Motley Fool, 2026-08-12 ↩↩↩↩↩↩↩↩↩↩↩↩↩
-
Atmos Energy Corporation — Company Profile, Information, Business Description, History — Reference for Business ↩↩↩↩↩↩↩↩
-
Atmos Energy Corporation — Encyclopedia.com, International Directory of Company Histories ↩↩↩↩↩↩↩
-
Atmos, TXU Gas Merger Creates Largest U.S. Gas Distribution Business — Natural Gas Intelligence, 2004-06-21 ↩↩↩
-
Atmos Energy Corporation Form 10-K for the fiscal year ended September 30, 2004 — U.S. Securities and Exchange Commission, 2004-11-24 ↩↩↩↩↩
-
Pipeline Accident Report NTSB/PAR-21/01: Atmos Energy Corporation Natural Gas-Fueled Explosion, Dallas, Texas, February 23, 2018 — National Transportation Safety Board, 2021-01-12 ↩↩↩↩↩↩↩↩↩↩
-
Atmos Replacing 25 Miles of Gas Pipe in Northwest Dallas After Deadly Explosion — The Dallas Morning News, 2018-03-01 ↩
-
Texas Seeks $1.6 Million From Atmos After Fatal Dallas Gas Explosion — The Dallas Morning News, 2021-04-01 ↩↩↩
-
Atmos Settles Lawsuit With Family of 12-Year-Old Dallas Girl Killed in 2018 Gas Explosion — The Dallas Morning News, 2019-05-30 ↩
-
Atmos Energy Corporation Form 10-K for the fiscal year ended September 30, 2021 — U.S. Securities and Exchange Commission, 2021-11-10 ↩↩↩↩↩↩↩
-
Railroad Commission Approves Securitization Financing Order — Railroad Commission of Texas, 2022-02-08 ↩
-
Atmos Quarterly Report: Company Spending and Profits Continue to Grow — Atmos Cities Steering Committee, 2026 ↩↩
-
Atmos Files for Five Interim Rate Increases under Controversial Program that Allows for Quick Approvals — Atmos Cities Steering Committee, 2026 ↩↩
-
Steering Committee, Atmos Reach Settlement for Rate Hike — Brownwood News, 2026-08-11 ↩↩
-
Atmos Energy Corporation 2026 Proxy Statement — Atmos Energy Corporation, 2025-12-18 ↩↩↩↩↩↩
-
Atmos Energy Announces Sale of Atmos Energy Marketing — Business Wire, 2016-10-31 ↩↩
-
Atmos Energy Corporation Completes Sale of Natural Gas Distribution Assets in Georgia — Business Wire, 2013-04-01 ↩↩
-
House Bill 4384 Bill Analysis, 89th Texas Legislature — Texas Legislature Online, 2025 ↩
-
ONE Gas Raises 2026 Financial Guidance and EPS Growth — The Globe and Mail, 2026 ↩↩
-
NiSource Announces Second Quarter 2026 Results — NiSource Inc., 2026 ↩↩↩
-
Spire Inc (SR) Q3 2026 Earnings Call Highlights — Yahoo Finance, 2026 ↩
-
Most Planned Natural Gas Pipeline Capacity Additions in 2026 and 2027 Originate in Texas — U.S. Energy Information Administration ↩↩
-
Atmos Energy (ATO) Q3 2026 Earnings Call Transcript — The Globe and Mail, 2026-08-06 ↩↩↩↩↩↩↩↩
-
Bill To Prevent Texas Cities From Banning Natural Gas Heads To Governor's Desk — Houston Public Media, 2021-05-05 ↩
 LinkedIn
 WhatsApp
 Reddit
 Hacker News
 Email
Email Kindle
 RSS Feed
 Spotify
 Apple Podcasts
 Amazon Music
 Audible
 YouTube