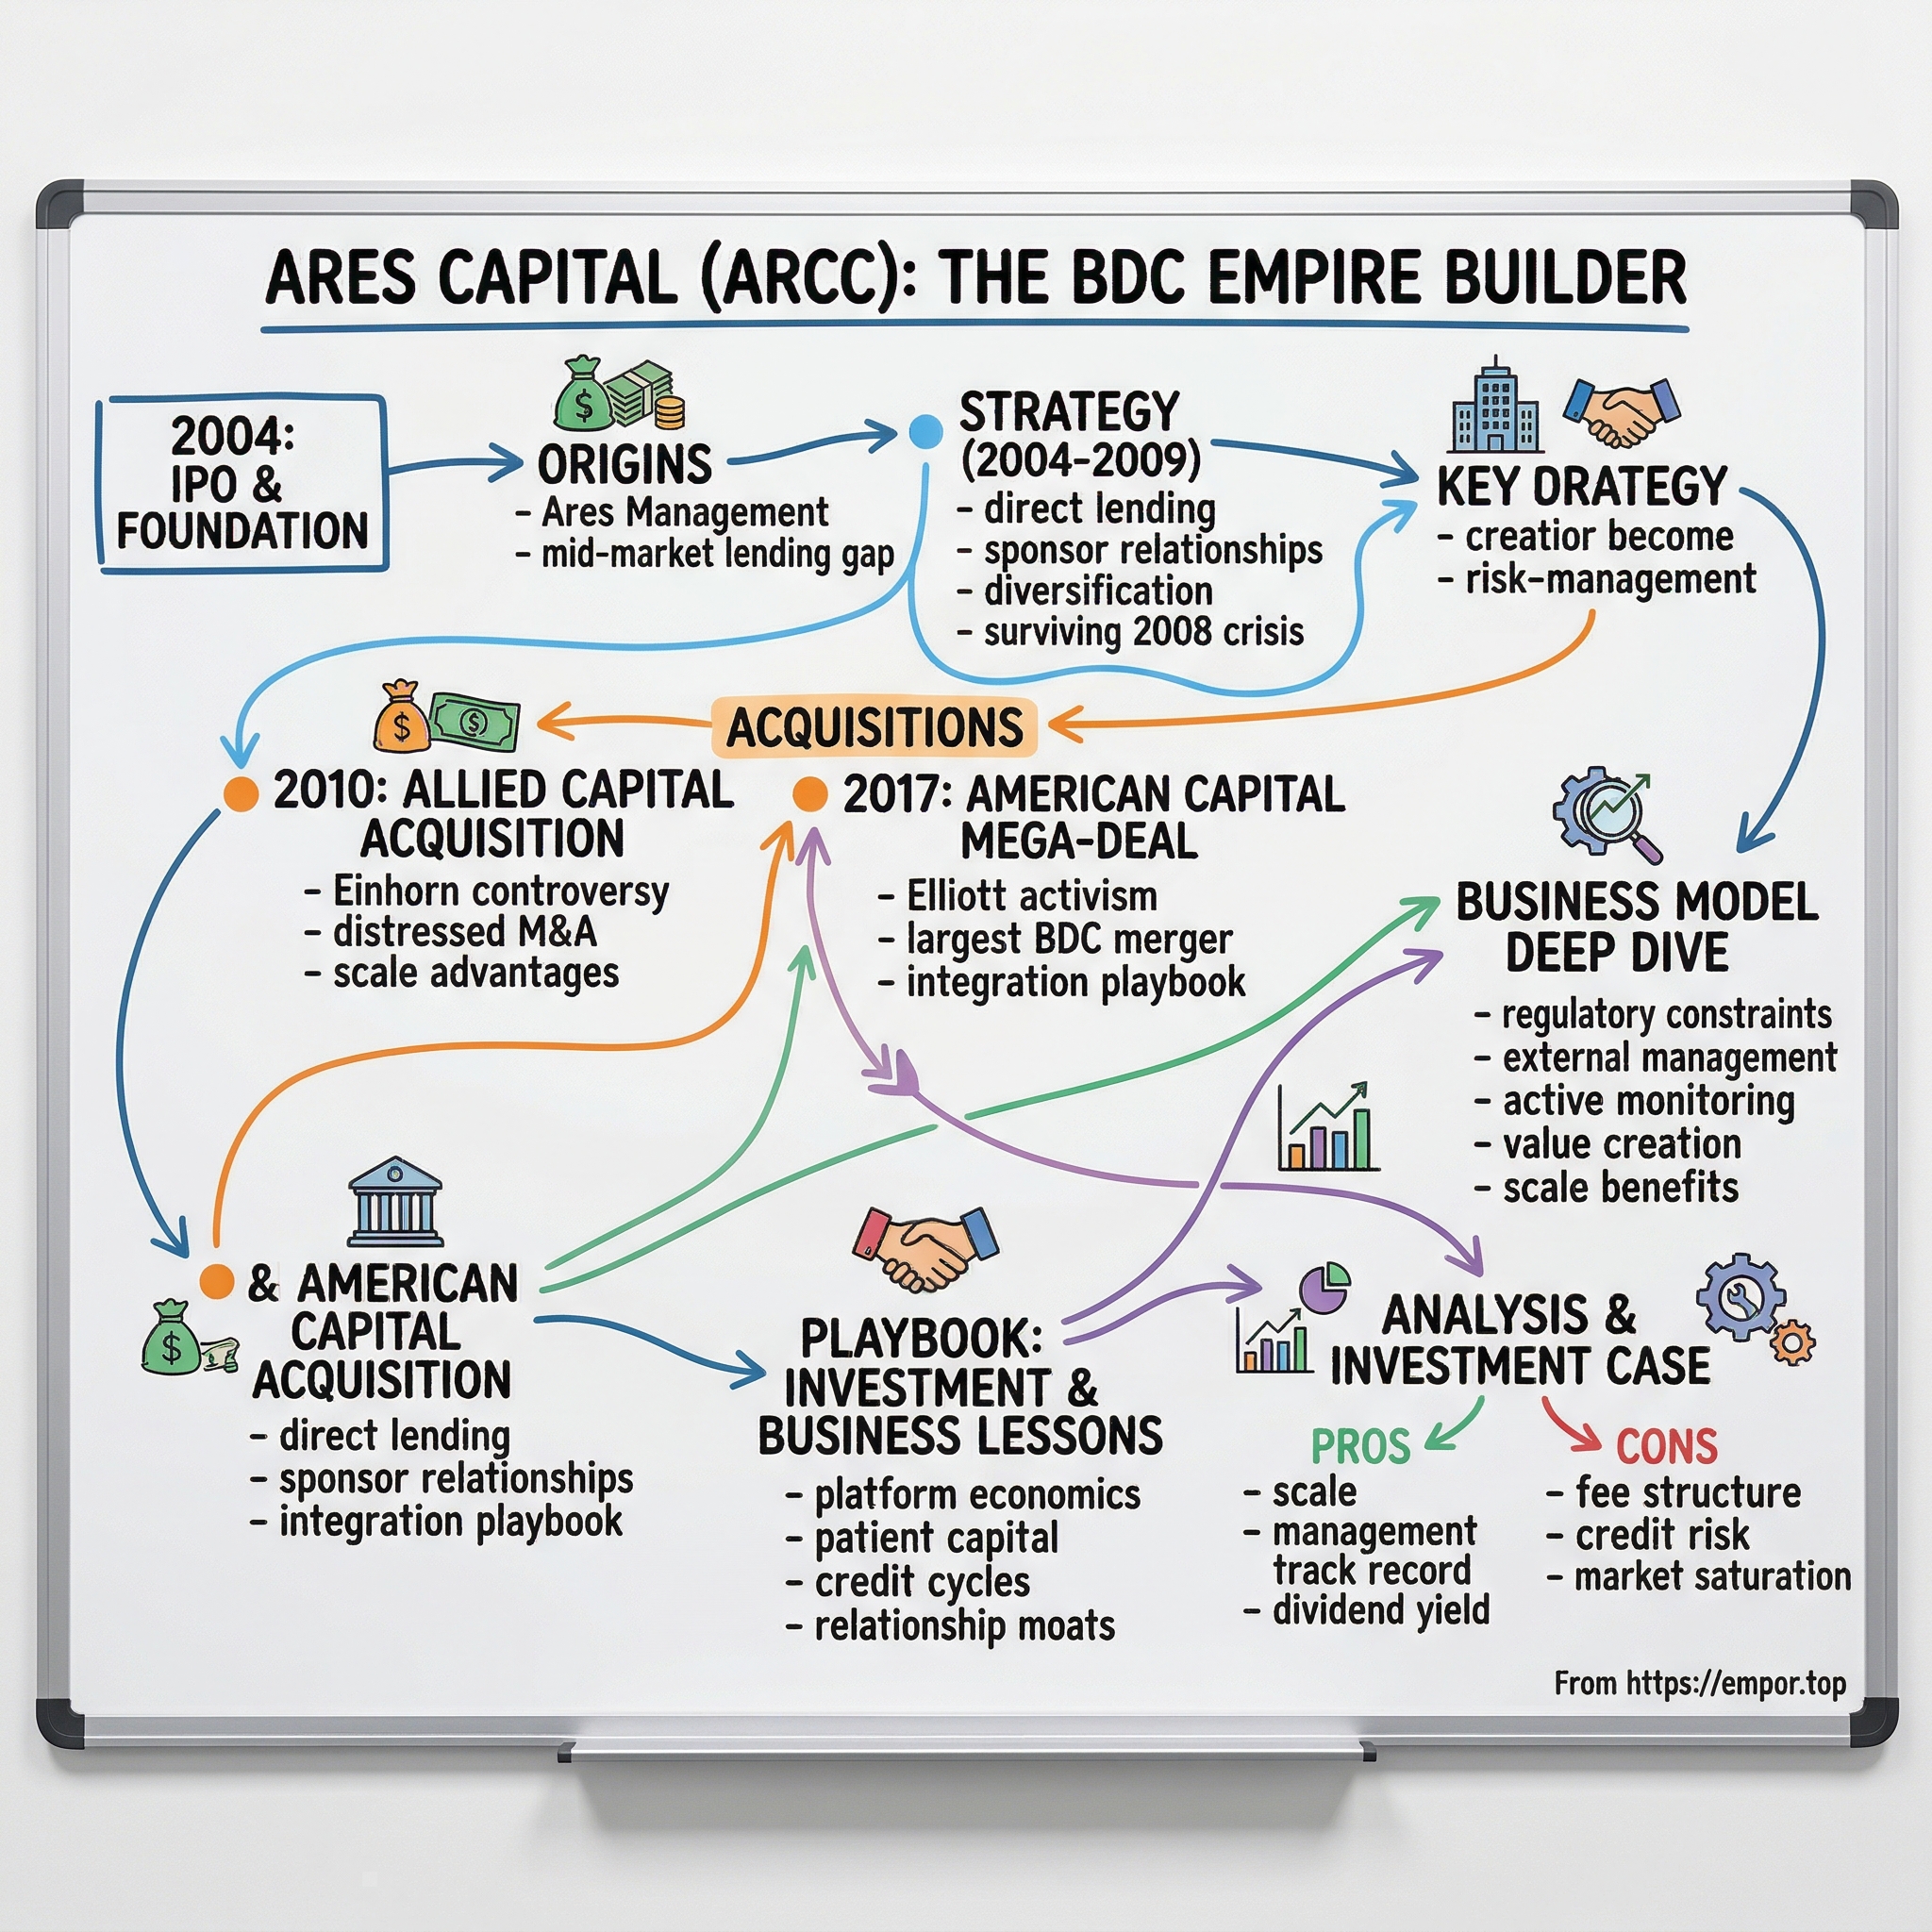
Ares Capital Corporation: The BDC Empire Builder
I. Introduction & Episode Roadmap
On October 5, 2004, a company that had existed for less than six months priced 11 million shares at $15.00 apiece on the Nasdaq, raising $165 million.1 The prospectus described a "newly organized closed-end, non-diversified management investment company" that intended to make first and second lien loans and mezzanine investments in private American middle-market businesses. There was no operating history and no employees—and there still are none today. What the company did have was a portfolio of securities it had contracted to buy for roughly $150 million, alongside a commitment that a seven-year-old Los Angeles credit firm called Ares Management would manage the capital for a fee.1
Twenty-two years later, that entity holds $29.3 billion in investments across 619 portfolio companies, standing as the largest publicly traded business development company in the United States.2 Its parent, Ares Management, oversees more than $671 billion in assets globally.3 Somewhere along the way, traditional commercial banks stepped back from primary middle-market lending, and direct lenders like Ares Capital stepped in to fill the void.
That transition defines the company's trajectory, though its expansion was neither linear nor effortless. The detailed operational history offers a far clearer view of the business than marketing victory laps suggest.
The central question. Ares Capital built its market position using three primary levers: a favorable regulatory and tax structure unavailable to standard corporations, two opportunistic acquisitions of distressed competitors during market dislocations, and the deal-sourcing power of its parent platform. The key question for investors in 2026 is whether those drivers remain effective. Direct lending is no longer a niche abandoned by commercial banks; it is now a crowded institutional asset class with hundreds of billions of dollars in dry powder competing for yield. Non-accrual loans at Ares Capital rose from 1.8% of amortized cost at the end of 2025 to 2.4% by June 30, 2026.24 Net asset value per share declined for two consecutive quarters, falling from $19.94 to $19.35.4 Payment-in-kind income—interest borrowers add to their principal balance rather than paying in cash—accounted for roughly a sixth of total investment income in 2025.2
None of those figures indicates an immediate crisis, but together they highlight emerging pressure points in the portfolio.
The core mechanics. As of June 30, 2026, total assets stood at $30.5 billion against stockholders' equity of $13.9 billion—representing roughly one dollar of borrowed money for every dollar of shareholder equity.4 The portfolio generated a weighted average yield of 10.5% on income-producing securities, funded at a weighted average cost of debt near 4.9%.42 Meanwhile, quarterly dividends of $0.48 per share have remained stable or grown for 68 consecutive quarters, bringing cumulative distributions to $35.24 per share since the IPO.418 Together, these metrics illustrate the engine: borrow efficiently using an investment-grade balance sheet, lend at attractive yields to middle-market borrowers, and distribute the net spread to shareholders as required by tax law.
That structural payout requirement is often understated by investors. Ares Capital cannot compound earnings like a traditional operating company because tax regulations require it to distribute nearly all net income.
Testing the thesis. Three load-bearing claims underpin the bull case, and each requires examination against Ares Capital's multi-decade record rather than management's framing:
- Regulatory arbitrage became a real business. The 1980 amendments to the Investment Company Act and the Regulated Investment Company tax election created the vehicle. However, the rules that eliminate corporate-level taxation also prohibit retaining earnings, forcing perpetual reliance on capital markets. That is a structural reality rather than a minor detail.
- Distressed M&A creates scale supremacy. Ares Capital acquired Allied Capital in 2010 and American Capital in 2017, both at discounts to stated book value. Whether public shareholders ultimately captured that value is distinct from whether the discount existed on paper, a distinction clarified by regulatory filings.
- Platform scale is a moat. Deal sourcing, hold capacity, and workout capabilities expand with platform size. However, so does the base management fee paid to the advisor. Evaluating the moat requires tracking where those economics ultimately flow.
The company's history also features a high-profile short-selling battle, a joint venture with General Electric that generated years of outsized income before unwinding, a fee waiver that revealed more about integration friction than press releases acknowledged, and a 2025 leadership transition that placed a 25-year Ares veteran in the CEO role just as credit conditions began to shift.
The story begins with the vehicle's foundation—and a piece of 1980 federal legislation that initially attracted little notice outside Washington.
 Subscribe on LinkedIn
II. Origins: The Ares Management Platform & The BDC Regulatory Canvas
Congress passed the Small Business Investment Incentive Act in 1980 to solve a plumbing problem. The Investment Company Act of 1940 had been written to protect retail investors from the abuses of 1920s investment trusts, with rules so restrictive that pooling public money to lend to private companies was effectively impossible. Small and mid-sized businesses too large for community banks yet too small for the bond market had nowhere to turn for growth capital.
The fix created a new vehicle: the business development company. A BDC is a closed-end fund required to invest at least 70% of its assets in private or thinly traded U.S. companies, offer significant managerial assistance to those portfolio businesses, and operate with meaningful leverage unavailable to ordinary mutual funds. Crucially, a BDC can list on a public stock exchange, allowing retail investors to own a portfolio of private corporate loans through a standard brokerage account.
Combining this structure with Subchapter M of the Internal Revenue Code makes it exceptionally efficient. A BDC electing regulated investment company status pays no corporate-level tax on distributed earnings, provided it pays out at least 90% of its taxable income to shareholders each year. Interest paid by borrowers passes through to investors taxed once rather than twice. For an asset class where total return depends on current income, eliminating corporate income tax is the difference between a viable product and an unviable one.
The double-edged sword. That tax efficiency comes with a permanent trade-off: a vehicle required to distribute virtually all earnings cannot compound profits internally. Unlike a commercial bank that retains earnings to build equity capital and expand its balance sheet independently, a BDC seeking to grow must either issue additional debt or sell new shares. Statutory rules cap total borrowing, while issuing shares below net asset value is restricted and dilutive. As a result, a BDC’s expansion depends on its equity valuation: trading above book value enables accretive share issuance, while trading below closes off capital-raising. Every major strategic choice—including both transformational acquisitions in Ares Capital’s history—derives from this structural constraint.
The platform behind the vehicle. Ares Management was founded in 1997 by executives whose formative careers were spent at Apollo Management and within Drexel Burnham Lambert’s high-yield credit group, including Antony Ressler, John Kissick, Bennett Rosenthal, and David Kaplan. Their core discipline was credit: leveraged loans, high-yield bonds, and structured products. That origin shaped their approach to capital preservation. Professionals trained in distress and high-yield markets focus primarily on downside protection, recovery value, and seniority in the capital structure—a risk-averse framework distinct from growth equity investment.
The executive who built Ares Management's direct lending franchise arrived later. Michael Arougheti joined from Royal Bank of Canada in 2004, where he had led a principal finance group. He became President of Ares Capital in May 2004 prior to its IPO, served in that role until 2013, subsequently became Chief Executive Officer of the BDC, and served for over a decade as Co-Chairperson of its board.5 Today, he serves as Chief Executive of Ares Management itself.3 This executive overlap illustrates a central feature of external management: the same executive built, managed, and chaired the BDC, and now leads the parent adviser charging management fees to the fund. While legal, fully disclosed, and standard across externally managed BDCs, this structural governance arrangement requires ongoing investor scrutiny.
What the leverage cap actually means. Understanding industry leverage limits requires decoding statutory asset coverage requirements. Originally set at 200%, the asset coverage test meant total assets had to equal at least twice total debt, capping borrowing at one dollar of debt for every dollar of equity. Unlike commercial banks, BDCs lack access to Federal Reserve discount window borrowing, federal deposit insurance, or lender-of-last-resort liquidity. Statutory asset coverage serves as the primary firewall preventing illiquid loan books from suffering forced liquidation during market downturns—explaining why Congress set the statutory limit directly and why its legislative relaxation in 2018 proved so consequential.
The commercial vacuum. By the early 2000s, two decades of U.S. banking consolidation had eroded middle-market commercial lending. Regional banks that previously underwrote medium-sized regional manufacturers were absorbed into national institutions focused on standardized, large-scale financial products. Simultaneously, the private equity industry expanded rapidly, creating substantial demand for acquisition debt. Financial sponsors required lenders capable of committing capital quickly, holding entire debt tranches, and remaining steadfast during market volatility.
Ares Capital incorporated in April 2004 and listed that October, with Merrill Lynch and Wachovia running the book.1 From inception, the entity was externally managed by Ares Capital Management LLC, a subsidiary of Ares Management, under an advisory agreement providing for a base management fee on total assets, an income-based fee, and a capital gains incentive fee—the standard three-part architecture that persists today.2 The commercial value proposition to private equity sponsors was direct and efficient: a single institutional counterparty offering comprehensive debt financing from senior loans to mezzanine capital without syndication risk.
Underwriting private middle-market borrowers requires specialized information gathering. Because these businesses lack public debt ratings, equity research, or public reporting, lenders must perform proprietary credit analysis—evaluating management, building financial models, structuring covenants, and holding illiquid loans to maturity. The yield premium on middle-market loans reflects compensation for illiquidity and credit analysis costs rather than excess risk-free return.
Simple pitches are easy to make and hard to keep. The first real test arrived four years later.
III. Forging the Underwriting Engine: Initial Portfolio & 2008 Crisis Stress Test
Between 2004 and 2007, Ares Capital expanded rapidly in a benign credit environment. Total investment income rose from a standing start to $188.9 million in 2007, as its portfolio grew to 78 companies and net asset value per share reached $15.47—above its $15.00 initial public offering price.6 The portfolio generated an 11.7% yield at fair value.6 Borrowers were typically sponsor-backed businesses generating $20 million to $100 million in earnings before interest, taxes, depreciation, and amortization (EBITDA), with Ares Capital deploying capital across first lien revolvers, second lien term loans, mezzanine notes, and small equity co-investments.
Those equity co-investments warrant attention because of their long-term impact on returns. When a lender takes a minority equity stake alongside a loan, it gains upside participation in a borrower's growth. While many of these stakes expire without value, a small fraction generates outsized gains that offset loan write-offs. Since its IPO, Ares Capital's net realized gains have exceeded net realized losses by roughly $1.0 billion, yielding an average annualized net realized gain rate of about 0.8%—an unusual net gain for a credit book that is largely attributable to those equity positions.2 This single structural dynamic explains a substantial portion of the firm's long-term returns.
The primary operational challenge during those initial years was building a deal-sourcing pipeline rather than assembling the loan book. Direct lenders do not use conventional advertising; deal flow depends on relationships with private equity sponsor partners. Securing those opportunities requires demonstrating that a lender will honor term sheets under market pressure, close transactions on schedule, and work constructively during borrower underperformance. Developing that track record requires executing live transactions and managing their multi-year aftermath. Consequently, direct lending platforms cannot be rapidly created simply by committing capital, though maintaining that competitive advantage requires continuous execution across market cycles.
Then the world broke.
In 2008, the global financial crisis froze the leveraged finance market. Commercial banks halted loan syndications, middle-market enterprise valuations collapsed, and a business model dependent on continuous access to debt and equity capital faced the simultaneous closure of both financing channels.
The falsification. Corporate history often suggests that superior initial underwriting insulated Ares Capital from the financial crisis. Regulatory filings present a more complex record.
Net asset value per share fell from $15.47 at year-end 2007 to $11.27 at year-end 2008, representing a 27% decline in book value over twelve months.6 The company recorded $266.5 million in combined net realized and unrealized losses during 2008, resulting in a net decrease in stockholders' equity of $139.5 million, or $1.56 per share.6 Total return measured by market price dropped 45.3% in 2008.6 In short, the stock lost nearly half its market value while book value contracted by more than a quarter.
Distribution cuts followed. In November 2009, the board reduced the fourth-quarter dividend to $0.35 per share from its previous $0.42 quarterly rate, bringing full-year 2009 distributions to $1.47 per share—down from $1.68 in 2008 and $1.66 in 2007.6 For an investment vehicle anchored on dividend yield, reducing payouts reflected direct pressure on underlying portfolio earnings power.
To maintain liquidity, Ares Capital issued equity while shares traded at a discount. By year-end 2009, total shares outstanding reached approximately 109.9 million against net assets of $1.26 billion.6 Issuing shares below book value provided essential capital for a non-retaining vehicle during a credit freeze, but it also diluted existing shareholders at a market low.
The market recovery in 2009 was swift. Total return based on market value reached 119.9% as share prices rebounded from distressed levels, while total return based on net asset value was 17.8%.6 However, investors who purchased shares at the 2007 peak and held through 2009 remained down on a book-value basis, with NAV per share ending 2009 at $11.44 compared to $15.47 two years earlier.6 While both figures appear across industry performance metrics, the net asset value decline reflects the full-cycle experience of buy-and-hold shareholders.
What the record actually supports. The historical record does not support assertions that Ares Capital possessed flawless crisis-era underwriting. What the evidence confirms is that the firm survived intact while multiple competitors failed—remaining solvent, maintaining dividend distributions, and positioning itself to expand post-crisis.
Management adjusted its underwriting strategy based on those credit losses. The most severe portfolio impairments occurred in second lien and mezzanine holdings—junior debt instruments offering higher yields but lacking senior rights during financial restructurings. Over the subsequent decade and a half, Ares Capital reallocated capital toward first lien and unitranche loans. By the end of 2025, first lien investments accounted for $17.9 billion of the $29.5 billion portfolio at fair value, with unitranche loans comprising $11.2 billion, while second lien positions declined to $1.5 billion.2 By mid-2026, second lien exposure had fallen to 4% of the total portfolio.4
This shift represented a permanent change in capital allocation directly informed by crisis losses, demonstrating an operational adaptation to credit stress.
By surviving the 2008 crisis intact, Ares Capital gained a significant strategic advantage: a functional balance sheet, access to capital markets, and an opening to acquire distressed competitors.
IV. The Allied Capital Takeover: Distressed M&A & Einhorn's Shadow
In May 2002, at the Ira Sohn investment conference in New York, Greenlight Capital founder David Einhorn presented a short thesis on Allied Capital Corporation. Founded in 1958, Allied was the oldest business development company in the market, widely held by retail investors for its high dividend yield.
Einhorn's argument focused on asset valuation rather than stock price movements. Allied held illiquid private securities that it valued internally, and Einhorn contended those marks were systematically inflated, overstating reported book value and the earnings supporting the dividend. Because auditors validate valuation procedures rather than independently pricing private portfolio holdings, reported asset values rely heavily on manager judgment—a framework where overstated marks can persist for years before market realities force a correction.
A protracted public dispute followed, involving regulatory scrutiny, public exchanges, and Einhorn's 2008 book detailing the campaign, Fooling Some of the People All of the Time.7 Having shorted Allied near $26 per share, Einhorn ultimately saw the stock collapse during the subsequent credit crisis.
The 2008 financial crisis exposed Allied's balance sheet vulnerabilities. Facing unrefinanceable debt maturities and forced portfolio markdowns, Allied became a distressed seller by 2009.
The deal. On October 26, 2009, Ares Capital and Allied Capital announced an all-stock merger valuing Allied at approximately $648 million, or about $3.47 per Allied share—a 27.3% premium to Allied's prior closing price.8 Allied shareholders received 0.325 Ares Capital shares for each share held, issuing roughly 58.3 million new shares and leaving Ares Capital shareholders with approximately 65% of the combined company.8 The transaction closed on April 1, 2010.9
Although the 27% premium appeared sizable relative to Allied's depressed stock price, the acquisition price represented a fraction of Allied's pre-crisis market value. The premium applied to a distressed market quote rather than intrinsic asset value, reflecting the economics of acquiring an impaired financial institution.
Alongside the merger, Ares Capital separately acquired Allied's interest in the Senior Secured Loan Fund—a joint venture established in December 2007 with roughly $3.6 billion of committed capital for unitranche lending—for $165 million in cash.8 Management projected that the combination would be accretive to both net asset value and core earnings in year one, while maintaining a pro forma debt-to-equity ratio of 0.65x to 0.75x at closing.8
The transaction transferred several hundred private loan and equity positions, a management infrastructure, and portfolio liabilities to Ares Capital at valuations set during widespread credit dislocation. Allied sold because it lacked equity currency and faced imminent debt maturities. By maintaining balance sheet capacity through 2008, Ares Capital was positioned to acquire a major competitor at a steep discount.
Management explicitly presented the acquisition as a consolidation strategy. Michael Arougheti, then President of Ares Capital, noted that the deal created a middle-market lender with "leading market coverage, access to capital, scale and diversification," positioning the firm "to be an industry consolidator."8
Did it work? Partly, and not the way the press release framed it.
Initial accounting results showed immediate gains. In 2010, Ares Capital recorded a $195.9 million bargain purchase gain, recognized when the fair value of acquired assets exceeds the purchase price.6 Net asset value per share increased from $11.44 at year-end 2009 to $14.92 at year-end 2010, total assets roughly doubled from $2.3 billion to $4.6 billion, and the portfolio company count expanded from 95 to 170.6 Total return based on net asset value reached 31.6% in 2010.6
The falsification. However, a bargain purchase gain represents an accounting adjustment at closing rather than an immediate cash inflow. Allied's portfolio contained legacy equity and real estate positions requiring multi-year workouts, creating operational drag. Total investment income grew modestly relative to the doubling in assets—rising from $245.3 million in 2009 to $483.4 million in 2010 and $634.5 million in 2011—while weighted average portfolio yield declined from 12.9% in 2010 to 12.0% in 2011 as high-coupon legacy assets were replaced or repaid.6 Portfolio turnover reached 45% in 2010 and 53% in 2011, compared with 26% in 2009.6 Elevated turnover and yield compression reflected an intensive, multi-year restructuring of the acquired asset book.
The merger established Ares Capital as the largest BDC by assets, confirming management's ability to execute opportunistic M&A. Yet integrating Allied required two years of active portfolio restructuring and yield adjustment, demonstrating that acquiring distressed BDC portfolios involves substantial operational costs.
The takeover also highlighted the centrality of asset valuation. Allied's collapse stemmed from illiquid portfolio marks that drifted from market realities. As Ares Capital manages $29.3 billion in assets valued under manager estimates approved by its board and reviewed by third parties, rigorous valuation integrity remains the key accounting foundation for the company's financial reporting.
With scale secured, the company focused on converting its expanded footprint into a repeatable lending platform.
V. Institutionalizing Direct Lending: Ivy Hill, JVs, & Bank Disintermediation (2010–2016)
Understanding how a business development company generates returns beyond basic loan spreads requires examining the specialized fee-bearing and off-balance-sheet structures attached to its balance sheet.
Ivy Hill. Ivy Hill Asset Management is a wholly owned portfolio company of Ares Capital and an SEC-registered investment adviser.10 It manages third-party capital—including collateralized loan obligations and private credit vehicles—with Ares Capital owning the underlying manager. As of December 31, 2025, Ivy Hill managed roughly $14.6 billion of assets under management across 23 vehicles, earned $52 million of management and incentive fees, and generated $282 million of other investment-related income.2 Ares Capital's investment in Ivy Hill carried a fair value of $2.4 billion, or 8.3% of the total portfolio at year-end 2025, rising to 10% by mid-2026.24
The strategic significance of this structure stems from the fundamental difference between credit assets and asset management platforms. A direct loan represents a fixed claim delivering coupon income and principal repayment. By contrast, an asset management business generates recurring fee income on third-party capital, which can be leveraged through CLO structures without consuming the BDC's own borrowing capacity. Ares Capital reported a $293 million dividend from controlled affiliates in 2025—the bulk of it cash rather than payment-in-kind income, derived primarily from this holding.2 Ivy Hill represents the highest return-on-equity asset in Ares Capital's portfolio, functioning as an operating business rather than a direct loan.
Structurally, Ivy Hill operates as a fund-of-funds embedded inside a fund. Shareholders effectively pay Ares Capital's management fee on an asset that itself earns fees from underlying vehicles. While regulatory disclosures outline this arrangement, the multi-layered fee structure reduces the transparency of underlying cash flows compared to a traditional loan book.
Mechanically, a collateralized loan obligation is an entity funded by issuing debt tranches ranked from safest to riskiest. The manager pools corporate loans, sells senior floating-rate tranches to institutional investors such as banks and insurers, and retains or places the equity tranche, which receives residual cash flows after senior obligations are paid. The manager earns a fee on the entire pool regardless of equity performance. That recurring fee stream forms the annuity base: Ivy Hill's $52 million in 2025 management and incentive fees represented that base, while the $282 million of other investment-related income reflected returns on its retained debt and equity positions.2
The GE joint venture. Alongside Ivy Hill, Ares Capital expanded its underwriting scale through the Senior Secured Loan Program, a joint venture originally acquired during the Allied Capital transaction. The structure combined GE Capital's low-cost senior debt financing with Ares Capital's subordinated certificates, which absorbed first-loss risk in exchange for residual interest spread. This pairing enabled the partnership to write large single-check unitranche loans that competed directly with syndicated commercial bank offerings, providing private equity sponsors with streamlined execution. For Ares Capital, the subordinated certificates delivered high-yielding, leveraged exposure to a diversified pool of senior middle-market loans.
The falsification. The thesis that joint ventures provide a durable competitive moat was disproven when its primary partner exited the market.
In 2015, General Electric decided to exit financial services and sold its U.S. sponsor finance business, Antares, to the Canada Pension Plan Investment Board. The Senior Secured Loan Program stopped originating loans and entered wind-down mode. In July 2017, in connection with the effective termination of the fund, Ares Capital purchased $1.6 billion in aggregate principal amount of the remaining first lien loans at par, assumed $50 million of unfunded commitments, and received a $1.5 billion liquidation distribution on its certificates.10 The purchased loans yielded 7.1%.10
That yield differential illustrates the structural impact. While the subordinated certificates had thrown off enhanced returns through leverage, the underlying senior loans yielded only 7.1%. Management stated the consequence directly in its 2018 annual report, noting that the portfolio's weighted average yield fell from 9.0% in 2016 to 8.5% in 2017, "primarily due to the declining yield of the SSLP Certificates" ahead of the liquidation.10 An income stream that had produced years of enhanced earnings power vanished when an independent partner executed an unrelated strategic decision.
To replace the lost capacity, Ares Capital established the Senior Direct Lending Program with Varagon Capital Partners in July 2016. Operating on a similar architectural framework, Ares Capital held subordinated certificates while Varagon and its clients funded senior notes and intermediate funding notes, with joint investment committee approval required. By the end of 2018, the partners agreed to make $6.4 billion available, and Ares Capital held 87.5% of the SDLP certificates.10 As of December 31, 2025, the SDLP represented 3.8% of the portfolio at fair value, held $4.3 billion of first lien loans across 39 borrowers, and yielded 8.5% at the loan level.2
Verdict on the moat claim. Joint ventures are capital-efficiency tools rather than permanent moats. They remain contractually terminable, partner-dependent, and capable of removing a material slice of earnings power on an external partner's timetable. Ares Capital's genuine capability lies in reconstructing such structures quickly under new partnerships—a real execution capability, but a lesser advantage than an unassailable moat. Investors should view joint venture distributions as lumpy, replaceable income streams rather than permanent annuities.
A key structural consideration for investors is that because Ivy Hill is a wholly owned portfolio company rather than a consolidated subsidiary, its balance sheet does not appear line by line inside Ares Capital's financial statements. What appears is a single fair-value figure—$2.4 billion at year-end 2025—determined by the same valuation process that governs every other private position.2 Ivy Hill is separately registered as an investment adviser with the SEC and files its own Form ADV, so the manager-level disclosure exists.20 However, the economics reaching Ares Capital shareholders represent a valuation output rather than an observable market price. When roughly a tenth of the portfolio consists of a self-marked asset management business, the valuation process is a central financial driver.
Meanwhile, in May 2014, parent adviser Ares Management listed on the New York Stock Exchange. That public listing created direct equity market oversight for the manager, introducing quarterly disclosure requirements and share price sensitivity to fee-related earnings. While alignment between an external manager and a fund is never complete, a publicly scrutinized manager offers greater operational legibility than a private entity.
Two years after that listing, an even larger and messier target came into view.
VI. The American Capital Mega-Deal: Scale Supremacy & Portfolio Restructuring (2016–2017)
American Capital, Ltd. had been the other titan of the business development company sector—a Bethesda-based firm that had expanded into a sprawling collection of buyout equity stakes, structured products, an externally managed mortgage REIT, and a large asset management division. By 2015, the firm faced mounting challenges: its share price traded well below reported net asset value, investors criticized its cost structure as bloated, and activist investor Elliott Management launched a campaign demanding that the company be broken up or sold.
The strategic review that followed led to an auction, which Ares Capital won.
The architecture. The transaction closed on January 3, 2017, in a cash-and-stock deal valued in the FY2018 annual report at approximately $4.2 billion.10 American Capital shareholders received total consideration of approximately $18.06 per share, with a distinct structure driving the payout:11
- $6.48 per share in cash plus 0.483 Ares Capital shares (worth $7.93 at the January 3, 2017 closing price), representing $14.41 per share directly from Ares Capital;
- $2.45 per share in cash generated by American Capital's separate sale of its mortgage management business to AGNC; and
- approximately $1.20 per share in cash—about $405 million—contributed directly by external manager Ares Capital Management LLC, "acting solely on its own behalf."11
Ares Capital issued roughly 112.0 million shares, leaving American Capital holders with 26.3% of the combined entity.11 On a pro forma basis, the portfolio expanded from $8.8 billion across 215 companies to approximately $11.8 billion across 314 companies, bringing total assets to $12.3 billion.11 Because American Capital held more than $1 billion in cash and no debt, the transaction actually reduced combined leverage.11
And then there is the fee waiver. Ares Capital Management agreed to waive up to $100 million of income-based fees over ten calendar quarters from the second quarter of 2017 through the third quarter of 2019—up to $10 million per quarter—"to support the expected profitability of the combined company during the integration and portfolio repositioning period."1110
Viewed through a skeptical lens, those concessions reveal the acquired portfolio's initial drag. An external manager does not voluntarily forgo $100 million of contracted fees, nor write a $405 million check from its own balance sheet, unless it expects the target assets to underperform short-term return hurdles. The manager's contribution and waiver served as clear evidence of alignment, but they also signaled that the acquired book required more than two years of active repositioning.
The falsification. Did shareholders receive a clean, immediately accretive bargain? The per-share record indicates otherwise.
Net asset value per share stood at $16.82 at year-end 2014, $16.46 in 2015, $16.45 in 2016, $16.65 in 2017, and $17.12 by year-end 2018.10 Over the four years spanning the joint venture wind-down and the American Capital integration, book value per share remained essentially flat, rising just 1.8% cumulatively. Total investment income moved from $1.025 billion in 2015 to $1.012 billion in 2016 and $1.160 billion in 2017—meaning that after absorbing $2.5 billion in acquired loan principal, top-line revenue rose only about 15% despite a far larger asset base.10 Total return based on net asset value was 7.2% in 2015, 9.2% in 2016, and 10.5% in 2017.10 Furthermore, the 2017 expense line was reported explicitly as "net of waiver of income based fees."10
Ultimately, the transaction expanded scale, diversified the loan book, delevered the balance sheet, and avoided structural distress. However, it did not deliver an immediate step-change in per-share earnings power or book value during the integration window. The assertion that Ares Capital acquired American Capital at a discount and instantly boosted per-share performance is unfulfilled by the financial record. The narrower, sustainable claim is that Ares Capital acquired a large, underperforming portfolio at a valuation low enough to prevent value destruction during a multi-year restructuring—emerging with roughly 50% more portfolio companies and the capacity to underwrite larger single transactions.
For a direct lender, scale provides a tangible competitive advantage. Private equity sponsors acquiring a $2 billion enterprise prefer lenders capable of holding $300 million or more without syndication, avoiding execution risk and market leakage. The transaction gave Ares Capital that balance sheet capacity. Whether the shareholders who funded the acquisition were adequately compensated for the four-year integration period remains questionable; returns were modest and depended heavily on manager subsidies.
What followed was a decade in which the direct lending industry's broader economics underwent two distinct structural shifts.
VII. The Modern Era: SBCAA 2.0x Leverage, Post-2022 Rate Hikes, & Private Credit Boom (2018–2026)
The regulatory unlock. In 2018, Congress passed the Small Business Credit Availability Act, reducing the asset coverage requirement applicable to BDCs from 200% to 150%.12 Translated: a BDC could go from roughly one dollar of debt per dollar of equity to two.
This was, on its face, a gift to managers paid on gross assets. Double the leverage, double the fee base, and let shareholders carry the incremental risk. What Ares Capital actually did is one of the more concrete data points in the governance file. When the board approved the lower asset coverage requirement effective June 21, 2019, the investment advisory agreement was simultaneously amended to cut the base management fee rate from 1.5% to 1.0% on all assets financed with leverage above 1.0x debt-to-equity.2 The 1.5% rate still applies up to 1.0x.
That is a real, contractual, and permanent reduction in the manager's take on incremental leverage, and it directly addresses the structural incentive problem. It does not eliminate it — 1.0% on levered assets is still a positive number, and the manager still earns more by growing the balance sheet than by shrinking it — but it materially blunts it. Management has also held actual leverage well inside the legal ceiling: 1.08x net of cash at the end of 2025 and 1.12x at June 30, 2026, against a stated target range of 0.9x to 1.25x that management reaffirmed on the second-quarter 2026 call.2413
The rate shock. Then came the fastest tightening cycle in four decades. Ares Capital's loans are overwhelmingly floating-rate — 94% of second-quarter 2026 new commitments were floating, of which 76% carried interest rate floors — while a large share of its own funding is fixed-rate unsecured notes.4 When SOFR went from near zero to above 5%, asset yields repriced immediately and much of the liability stack did not. Net investment income expanded mechanically.
The magnitude is visible in the filings. Total investment income rose from $2,614 million in 2023 to $2,990 million in 2024 to $3,052 million in 2025.2 Net investment income reached $1,436 million in 2024 and $1,415 million in 2025.2 Core earnings per share were $2.01 for full-year 2025, comfortably covering the $1.92 of regular dividends, and the company ended 2025 with $988 million — $1.38 per share — of spillover income available for future distributions.14 Net asset value per share ended 2025 at $19.94.2
The falsification. The claim that floating-rate direct lending generates unassailable risk-adjusted returns in a high-rate regime does not survive contact with what higher rates do to the borrower on the other side of the loan.
Start with the mechanism. A company borrowing at SOFR plus 500 basis points saw its cash interest expense roughly double between 2021 and 2023 without any change to its business. Interest coverage — earnings divided by interest expense — compressed across the entire middle market. Lenders responded, in many cases, by letting borrowers pay part of the coupon in kind: adding it to principal rather than paying cash. PIK converts a cash-flow problem into a balance-sheet problem and defers the reckoning.
Here is the plainest analogy. Imagine a landlord whose tenant cannot make rent, and who agrees that the missed rent will simply be added to what the tenant owes when they eventually move out. The landlord's income statement still shows full rent collected. The landlord's bank account does not. Everything depends on whether the tenant is good for it at the end. PIK is that arrangement, written into a loan agreement.
Ares Capital's own income statement quantifies its exposure. In 2025 the company recognized $219 million of PIK interest income and $268 million of PIK dividend income across all investment categories, against $3,052 million of total investment income — roughly 16% of the top line arriving as accretion rather than cash.2 The comparable figures were about 15% in 2024 and about 14% in 2023.2 The trend is up, and it is up during a period management describes as healthy.
To be fair to the disclosure, not all of that is stress. A meaningful share of the PIK dividend line comes from preferred equity structured as PIK from inception, and management has repeatedly told analysts that roughly 90% of PIK is structural — negotiated at origination — rather than the result of a workout. On the second-quarter 2026 call, KBW's Paul Johnson pressed specifically on whether that ~90% figure still held; management said it did, and added that PIK appeared on fewer transactions during the quarter than in prior years.13 That is a reasonable answer, and it is unverifiable from outside the filings. An investor should treat it as a management assertion with a decent track record behind it, not as a fact.
Non-accruals tell a cleaner story because the definition is not negotiable. Loans on non-accrual status were 1.7% of amortized cost at the end of 2024, 1.8% at the end of 2025, 2.1% at the end of the first quarter of 2026, and 2.4% at June 30, 2026 — with the fair-value figure rising from 1.0% to 1.4% over the same span.2415 Four new borrowers went on non-accrual in the second quarter of 2026 alone.13
Management's framing is that this is mean reversion, not deterioration. Asked directly by Wells Fargo's Finian O'Shea whether the credit headwinds represented "a new normal or cyclical normalization," and by Citizens' Chris Muller whether the trend reflected specific portfolio problems, executives pointed to a long stretch of below-average industry non-accruals and an expected reversion toward historical means, with no particular industry concentration behind the new additions.13 The context supports them: Ares Capital's own long-run non-accrual average has run near 3%, above where the book sits today, and industry-wide the picture is worse — debt tranches on non-accrual at the ten largest BDCs reached roughly 3.95% of debt at cost in the second quarter of 2026, and 31 borrowers were added to non-accrual across the sector in a single reporting week in May 2026.16
The spread story reversed. One widely repeated bear point deserves correction, because the 2026 data goes the other way. Unitranche spreads did compress badly through 2024 and into early 2025 as capital flooded private credit. But by 2026 the direction had changed: on the first-quarter call management reported first lien spreads roughly 20 basis points wider quarter-over-quarter with leverage down half a turn, and on the second-quarter call noted spreads on new senior loans about 20 basis points wider than the fourth quarter of 2025 with upfront fees up 50 basis points in the upper middle market.1513 Sector-wide, BDCs reported spreads roughly 50 basis points above 2025 tights.16
The reason is not comforting, though. Spreads widened because deal volume collapsed and competitors pulled back — better pricing on a smaller pipeline. Ares Capital's second-quarter 2026 gross commitments of $2.6 billion were roughly flat year-over-year while exits ran at $2.9 billion, shrinking the portfolio from $29.5 billion to $29.3 billion.4 Management described a "moderately below-average closing ratio" reflecting selectivity, and noted that 75% of transactions were with incumbent borrowers.17 A lender that mostly lends more money to companies it already lends to is either exercising informational advantage or extending its own exposures. Both readings are available from the same fact.
Where that leaves the thesis. Higher rates were a windfall on the asset side and a slow-acting stress on the borrower side. Net asset value per share has now declined two quarters running — $19.94 to $19.59 to $19.35 — driven by unrealized marks, including a $183 million net unrealized loss in the second quarter of 2026 that turned a $359 million net investment income quarter into $171 million of GAAP net income.415 The dividend was maintained at $0.48. The gap between $0.47 of core EPS and $0.48 of dividend was covered by spillover, not by current earnings.
That is the single most important operating fact in this section, and it deserves to be said without euphemism: at current run-rate earnings, the regular dividend is being funded partly from accumulated undistributed income rather than from what the portfolio earned this quarter. Spillover of $1.38 per share provides real cushion — several quarters of it.15 It is a buffer, not an earnings stream.
To judge whether that buffer will be needed, it helps to understand exactly where the money comes from.
VIII. Business Model Deep Dive: Capital Structure, Ivy Hill, & Economic Drivers
Ares Capital can be understood as three distinct businesses operating under a single ticker.
Business one: the senior loan book. As of June 30, 2026, first lien senior secured loans represented 59% of the portfolio at fair value, second lien positions stood at 4%, and SDLP certificates made up another 4%.4 The weighted average yield on debt and other income-producing securities was 10.5% at fair value, or 9.4% across total investments when including non-yielding equity.4 Unitranche serves as the core product: a single loan that blends what was historically a senior revolver and a subordinated tranche into one instrument at a single rate. For borrowers, that structure provides one counterparty and one set of documentation. For the lender, it ensures full control over the debt stack—applying a key lesson from the 2008 financial crisis. When a unitranche borrower breaches a covenant, Ares Capital is not one voice among a syndicate; it commands sole control.
While unitranche financing sounds like financial jargon, the underlying mechanics are straightforward. Historically, a leveraged buyout required a complex capital stack: a bank revolver at the top, a term loan underneath, and a mezzanine note at the bottom, each tied to a different lender, legal agreement, and intercreditor arrangement. Negotiating those layers took weeks and demanded unanimous alignment. Unitranche collapses that structure into a single loan at a blended rate from a single lender. Private equity sponsors gain speed and execution certainty, while the lender secures the entire economic yield and unilateral authority over debt terms. The risk is concentration: a single lender holds the entire exposure, leaving no syndicate partners to share potential losses.
Business two: the junior and equity book. Senior subordinated loans accounted for 6% of the portfolio as of mid-2026, preferred equity represented 8%, and other equity comprised 9%.4 Preferred equity holdings generate much of the firm's payment-in-kind dividend income. The remaining equity tranche—valued at $2.5 billion at fair value against $2.0 billion of amortized cost at year-end 2025—functions as a co-investment upside generator.2 Management reported approximately $470 million in gross gains from equity co-investment monetizations in 2025, achieving an average internal rate of return above 25%.14 This co-investment mechanism explains how a credit portfolio has generated net realized gains over two decades. However, it remains the firm's least predictable revenue source, tied directly to private equity exit activity that has remained sluggish since 2022.
Business three: Ivy Hill. As detailed previously, this asset management subsidiary accounts for 10% of the portfolio.4
The liability stack is the actual edge. Ares Capital maintains investment-grade credit ratings from all three major rating agencies—BBB from S&P, Baa2 from Moody's, and BBB from Fitch as of March 31, 2026.18 Moody's Baa2 rating sits a notch above the minimum investment-grade threshold, a crucial distinction that provides ongoing access to the institutional unsecured public bond market.
At year-end 2025, the weighted average stated interest rate across approximately $16.0 billion of principal debt was 4.9%.2 Measured against a 10.5% portfolio asset yield, the core economics are clear: the enterprise operates on the net interest margin between its borrowing costs and lending rates, magnified by roughly one-to-one leverage. Ares Capital disclosed that it requires a minimum 2.5% return on total assets just to cover interest expense.2 The accompanying disclosure underscores the symmetric impact of leverage: a 10% decline in portfolio return would result in a 27.25% loss for common shareholders.2 Financial leverage amplifies returns equally in both directions.
During the second quarter of 2026, the company raised approximately $1.2 billion in financing, expanded and extended two bank credit facilities, and introduced what Chief Financial Officer Scott Lem described as the first commercial paper program in the BDC sector—a short-term borrowing tool that management estimated could lower interest expense by 50 to 100 basis points on covered balances.417 Total available liquidity reached approximately $6.0 billion, with no significant debt maturities due in the near term.4
That commercial paper program warrants a structural caveat. Short-term wholesale funding is inexpensive specifically because of its short maturity, yet it is typically the first liquidity source to dry up during market dislocations—a recurring lesson from past banking crises. Because Ares Capital holds long-term, illiquid private loans, relying heavily on debt that must be refinanced every few weeks increases asset-liability mismatch risk. While current commercial paper balances remain modest and backed by committed credit facilities, the shifting debt mix requires ongoing monitoring.
The fee structure, precisely. The base management fee is set at 1.5% per year on average total assets excluding cash, including assets acquired through leverage, declining to 1.0% for assets funded by debt exceeding a 1.0x debt-to-equity ratio.2 The income-based incentive fee evaluates pre-incentive-fee net investment income against a quarterly hurdle rate of 1.75%, or 7% annualized. Returns above that benchmark trigger a 100% catch-up provision for income between 1.75% and 2.1875%, with the manager receiving 20% of incremental income thereafter.2 Additionally, the capital gains incentive fee is 20% of cumulative net realized gains minus unrealized depreciation, calculated with a full historical lookback for prior portfolio losses.2
In 2025, management fees totaled $425 million in base management fees, $348 million in income-based incentive fees, and a negative $23 million capital gains fee accrual—set against $1,594 million in total expenses, of which $793 million was interest.2 Advisory fees thus represented roughly half of all operating expenses and approximately 25% of total investment income.
The structural criticism, stated fairly. The annual report acknowledges a core asymmetry in the agreement: "if we earn pre-incentive fee net investment income in excess of the hurdle rate for a quarter, we will pay the applicable income based fee even if we have incurred a loss in that quarter due to realized and/or unrealized capital losses."2 Performance in the second quarter of 2026 illustrated that mechanism, generating $359 million in net investment income alongside $183 million in net unrealized losses, which triggered the income-based incentive fee despite the drop in asset marks.4 While the capital gains fee incorporates a historical lookback, the income fee operates independently each quarter.
This structure is fully disclosed, standard across the BDC sector, and inherently asymmetric. Practical mitigants exist: the lower base fee rate on incremental leverage, the negative capital gains accrual in 2025 that credited value back to shareholders, and two historical instances where the external manager waived fees or contributed capital directly. Nevertheless, shareholders face two parallel realities: while the manager has repeatedly provided voluntary concessions during portfolio adjustments, the legal contract continues to permit incentive fee payouts during quarters when net asset value declines.
That structural tension underscores the importance of leadership oversight in managing the platform's capital allocation choices.
IX. Management, Governance, & Leadership Succession: The Schnabel Era
On February 5, 2025, Ares Capital announced that Kort Schnabel would become Chief Executive Officer effective April 30, with R. Kipp deVeer stepping down after nearly eleven years in the role while remaining on the board and the investment adviser's investment committee.19
Corporate succession announcements are often routine, but this transition contained a notable detail: Schnabel joined Ares Management in 2001 and was a founding member of its U.S. Direct Lending strategy in 2004—the same year Ares Capital was launched.19 Having spent a quarter-century at the firm, virtually his entire career has centered on direct lending. Prior to stepping into the chief executive role, he served as Co-Head of U.S. Direct Lending and Co-President of the BDC.
That appointment represents continuity rather than disruption—a defensible posture for a credit business where underwriting discipline relies on institutional memory. DeVeer framed the handoff by noting he had "worked closely with Kort over the past 20 years" and observed "his investing acumen, commitment to long-term borrower relationships," standard executive messaging backed by an unusually long shared tenure.19
Jim Miller, appointed Co-President in October 2024, remained as sole President.19 Scott Lem serves as Chief Financial Officer, succeeding Penni Roll, who held the post during the American Capital transaction.114 The board is co-chaired by Mitchell Goldstein and Michael L. Smith, both senior leaders within the Ares Credit Group.195
The governance structure, stated plainly. Ares Capital has no internal employees. Its executive officers receive no direct compensation from the entity, as each is paid directly by Ares Management.5 Interested directors—including Michael Arougheti and Kipp deVeer—receive no board compensation from the BDC, whereas the six independent directors received annual fees ranging between $243,000 and $285,000 in 2024.5 The board is divided into three staggered classes, exposing roughly one-third of the seats to shareholder election each year. KPMG LLP serves as independent auditor, billing $4.2 million in total fees for 2024.5
Combined, these arrangements define an investment fund rather than a conventional operating enterprise. Ares Capital grants no management equity, maintains no internal long-term incentive plan tied to per-share results, and presents no advisory compensation vote to shareholders. Executive incentives align with Ares Capital primarily through Ares Management's overall profitability and personal shareholdings. Furthermore, the staggered board structure creates high hurdles for activist proxy challenges. While standard for externally managed BDCs, these mechanics diminish standard mechanisms of shareholder governance relative to internally managed peers.
Testing management credibility against the record. Three specific behaviors are checkable.
Did they cut their own fees when statutory rules allowed higher leverage? Yes—the 2019 amendment reducing the base management fee to 1.0% on assets financed with leverage above 1.0x debt-to-equity represented a permanent contractual concession made when the manager could have maintained the full 1.5% rate.2
Did the manager commit its own capital during complex transactions? Yes—Ares Capital Management contributed approximately $405 million in cash and agreed to waive up to $100 million in income-based incentive fees over ten quarters during the American Capital integration.11
Has management maintained consistent guidance across earnings calls? Generally. Executives repeatedly cited a net leverage target of 0.9x to 1.25x across the fourth-quarter 2025, first-quarter 2026, and second-quarter 2026 calls, maintaining actual borrowing within that band.141513 On the fourth-quarter 2025 call, CFO Scott Lem provided specific guidance, estimating that lower base rates would create "about $0.01 per share of earnings headwind for us in 2026"—a concrete, verifiable projection.14 On the first-quarter 2026 call, responding to analyst inquiries regarding potential artificial intelligence disruption across software holdings, management commissioned an independent consultant review and published the results: 85% of software investments were categorized as low AI risk, 14% as medium risk (representing 3% of the total portfolio), and 1% as high risk (0.3% of the total portfolio).15 While external observers cannot independently verify the underlying model, publishing specific risk metrics provided verifiable data points rather than generic reassurance.
Where the language strains. In the second-quarter 2026 earnings release, Schnabel highlighted "healthy portfolio performance and historically low levels of non-accruing loans and problem assets"—within the same filing showing non-accruals rising from 1.8% to 2.4% of amortized cost over six months.4 Both characterizations possess factual basis: a 2.4% rate remains below the firm's historical average of roughly 3%, even as it represents a one-third increase over two quarters. Emphasizing absolute historical levels rather than recent credit drift reflects standard investor relations messaging, serving as a reminder that corporate disclosures are framed by the management team being evaluated.
A second-layer note on accounting signals. In the fiscal 2023 and 2024 financial reports, KPMG issued unqualified audit opinions, with fee disclosures reflecting standard non-audit allocations—comprising $2.9 million in audit fees alongside $600,000 in audit-related services and $700,000 in tax fees for 2024.5 The central accounting judgment for a direct lender centers on the fair valuation of Level 3 private securities rather than revenue recognition or loan-loss reserves. Ares Capital evaluates a $29.3 billion portfolio composed primarily of unquoted private assets, where valuation marks rely on internal estimates approved by the board, explaining how the second quarter of 2026 recorded $183 million in net unrealized losses without impacting cash flow.4 For investors seeking independent validation of balance-sheet marks, cumulative realized gains upon asset exits offer the most reliable benchmark over time.
The falsification on alignment. The broad assertion that an external manager's incentives align fully with fund shareholders does not withstand structural analysis. Management fees calculated on gross assets incentivize balance-sheet expansion; income-based incentive fees remain payable during quarters with capital losses; and classified board governance limits direct shareholder recourse. Furthermore, the parent manager's public equity holders possess economic interests distinct from BDC investors. A narrower, more defensible proposition is that Ares Management has repeatedly surrendered contracted fees during periods of portfolio strain, establishing a track record of capital contributions and fee concessions unmatched by most externally managed peers. The critical test for this thesis will be whether management maintains these fee concessions and leverage limits during the next major credit downturn.
With the operational mechanics and leadership structure established, the strategic outlook comes into focus.
X. The Investment Spine, 7 Powers & 5 Forces: Why ARCC Wins (and Why It Might Not)
Strip away the balance sheet and ask the central question for a long-term investor: what stops a well-capitalized newcomer from replicating this business?
Hamilton Helmer's 7 Powers, applied honestly.
Scale economies — strong, and the most defensible power here. Fixed underwriting costs—including diligence, legal counsel, credit analysis, and workout staff—are spread across a $29.3 billion portfolio. More importantly, hold size functions as a distinct product feature. Private equity sponsors acquiring large businesses prefer lenders capable of committing $300 million or more without syndication risk. Few direct lenders can match that capacity. Ares Capital's $6.0 billion in available liquidity and investment-grade balance sheet access are prerequisites for competing in the upper-middle market.4 While this advantage is difficult to build quickly, it is ultimately replicable by institutions with sufficient capital—which the private credit market now possesses in abundance.
Cornered resource — moderate. Ares Capital's portfolio included 273 separate private equity sponsors as of June 30, 2026.4 Two decades of sponsor relationships cultivated across a broader $671 billion parent platform provide a real deal-sourcing engine.3 However, sponsor relationships are rarely exclusive. Private equity firms routinely run competitive auctions and choose lenders offering tighter pricing or looser terms. Describing these relationships as a "cornered resource" overstates their lock-in; they form an advantaged origination funnel rather than a closed ecosystem.
Process power — moderate to strong, but undertested in a prolonged downturn. Reallocating capital toward first lien and unitranche loans provides a structural process advantage, putting Ares Capital at the head of the table during restructurings rather than among junior creditors. The workout capabilities of the broader Ares platform are extensive. However, the last prolonged credit crisis occurred in 2008–2009 under a lower-seniority portfolio mix and earlier executive leadership. The recent upward drift in non-accrual loans marks the initial stage of a cyclical test rather than its conclusion.
Network economies — weak. Direct lending exhibits no structural network effects. Adding another corporate borrower does not increase the platform's utility to existing or future borrowers. The firm's main advantage is reputational—sponsors value execution certainty—and reputation does not constitute a network effect.
Switching costs — weak to moderate. Refinancing a private loan incurs legal fees and administrative effort, yet borrowers refinance frequently when market rates fall or cheaper capital becomes available. Management reported that incumbent borrowers accounted for 75% of second-quarter 2026 commitments, reflecting a combination of relationship continuity and subdued overall merger activity.17
Counter-positioning — historically decisive, now largely eroded. Direct lending originally gained market share by offering private equity sponsors speed, confidentiality, and execution certainty without rating agency requirements or market-flex pricing risks. Commercial and investment banks could not easily match this model due to regulatory capital constraints and syndication dependencies. That structural arbitrage established the asset class, but it has since been neutralized as dozens of institutional competitors now offer identical terms.
Branding — not material. Middle-market corporate borrowers do not pay higher interest rates or accept tighter terms simply for a lender's brand name.
Porter's Five Forces.
Threat of new entrants — high. Inflow of institutional capital represents the primary long-term challenge for incumbent lenders. Insurance companies, sovereign wealth funds, non-traded perpetual BDCs, and global asset managers have flooded into direct lending. Because capital is a commodity, the primary barriers to entry are building an origination team and establishing a track record over time.
Buyer power — high. Major private equity sponsors run competitive bidding processes among lenders, successfully negotiating lower interest spreads and weaker covenant protections over recent years. The modest spread widening observed in 2026 resulted from subdued transaction volume and temporary lender selectivity rather than a permanent shift in pricing power back to lenders.
Supplier power — low to moderate. Capital providers—primarily bondholders and bank credit facility lenders—represent the supply side. Investment-grade credit ratings and $6.0 billion in total liquidity provide Ares Capital with borrowing costs lower than most peers, allowing scale to translate directly into funding advantages.
Substitutes — moderate to high. When public high-yield bond markets and broadly syndicated loan channels open up with lower rates, upper-middle-market borrowers frequently refinance out of private debt. While early repayments return capital to lenders, they also eliminate higher-yielding assets from the loan book.
Rivalry — high. Direct competitors such as Blue Owl Capital Corporation, Blackstone Secured Lending, Golub Capital BDC, Sixth Street Specialty Lending, and Goldman Sachs BDC compete aggressively for quality deals. In mid-2026, several peer BDCs opted to repurchase their own discounted shares rather than deploy capital into new loans—signaling that risk-adjusted returns on new originations had become less compelling than buying back their own equity.16
Why it wins from here. The strongest bull case rests on long-term track record figures disclosed in regulatory filings. From its October 2004 IPO through December 31, 2025, exited investments generated an asset-level gross internal rate of return of approximately 13%, returning roughly $71.7 billion on $55.7 billion of invested capital. Over that two-decade span, cumulative net realized gains exceeded losses by about $1.0 billion, translating to an average annualized net realized gain rate of 0.8%.2 Generating positive net realized gains across two major credit cycles is rare in corporate lending. Combined with low liability costs, recurring distributions from Ivy Hill, and a manager that has historically conceded fees during integration periods, the long-term investment case retains a clear logical foundation.
Why it might not. Four mechanisms, in descending order of potential impact on long-term returns:
Asset yields are compressing while borrowing costs remain elevated. The weighted average yield on new debt investments funded in the second quarter of 2026 fell to 9.4% at amortized cost, compared to 10.3% on the existing portfolio.4 As new loans originate at lower interest rates while existing fixed-rate liabilities refinance at higher prevailing rates, net interest margins face an arithmetic squeeze. This margin compression represents the most direct threat to full dividend coverage from quarterly net investment income.
Payment-in-kind income defers rather than resolves borrower liquidity pressures. With payment-in-kind interest and dividends accounting for 16% of total investment income in 2025, a significant portion of reported earnings is non-cash accretion.2 While management asserts that roughly 90% of PIK income is structured from origination rather than triggered by workouts, that proportion cannot be independently verified from regulatory filings. If PIK balances are ultimately converted to equity in corporate restructurings rather than collected in cash, today's reported income turns into tomorrow's realized loss.
Credit metrics are normalizing upward toward historical averages. Non-accrual loans rising by 60 basis points at cost over six months,4 four new defaulting borrowers added in a single quarter,13 and a broader BDC sector non-accrual rate near 4% do not indicate a systemic crisis.16 However, the direction of credit quality is clear, and historical loss averages remain above mid-2026 levels.
Market commoditization. The regulatory and structural arbitrage that launched the direct lending industry has largely run its course. The remaining advantages—scale and cost of capital—gradually diminish as institutional rivals build competing balance sheets.
Myth versus reality, four consensus claims checked.
Myth: Ares Capital maintains a near-zero credit loss rate. Claims of negligible annual credit losses conflate gross loan losses with net portfolio performance. Filings show an average annualized net realized gain rate of about 0.8% since the 2004 IPO, which reflects loan write-offs netted against gains from equity co-investments.2 The underlying loan portfolio has incurred credit losses over time; equity co-investment gains have simply exceeded those losses. That reflects strong overall portfolio construction rather than flaw-free debt underwriting.
Myth: the loan portfolio is composed almost entirely of floating-rate debt. Floating-rate investments represented 71% of the portfolio at fair value as of June 30, 2026, below the 90-plus percent estimates often cited in market commentary.4 Equity holdings, preferred stock, and joint venture certificates account for the remaining 29%. Consequently, earnings sensitivity to benchmark interest rate changes is meaningful, but less extreme than simplified models assume.
Myth: borrower interest coverage has dropped to distressed levels. Management reported an average portfolio interest coverage ratio of 2.2 times at year-end 2025, reflecting modest year-over-year improvement alongside a quarter-turn reduction in average borrower leverage.14 Narrative claims that coverage has fallen toward 1.5 times conflict with reported figures. Furthermore, management disclosed that portfolio company EBITDA expanded by roughly 8% in the second quarter of 202617 and grew approximately 9% organically in 2025, outperforming the 4% growth rate observed across the broader leveraged loan market.14 While these metrics derive from manager-reported data across unquoted portfolio companies, they indicate operational stability among underlying borrowers rather than widespread distress.
Myth: loan spreads are experiencing continuous compression. Direct lending spreads tightened significantly through 2024 and early 2025, but management and industry data confirm spreads widened in early 2026.131516 This repricing resulted primarily from a slowdown in private equity buyout transactions and reduced lender risk appetite rather than enhanced pricing power among direct lenders.
The verdict. Ares Capital's competitive moat is tangible, but narrower than popular narratives suggest. Its primary advantages rest on borrowing cost efficiency and large transaction hold capacity—two quantifiable strengths that offer durable medium-term protection even as institutional competition intensifies. The platform does not possess structural lock-in driven by network effects, high switching costs, or brand pricing power. Investors should evaluate Ares Capital as a disciplined, scale-advantaged credit manager navigating a maturing, highly competitive asset class, rather than an unassailable franchise with permanent market power.
XI. Playbook: Business & Investing Lessons
1. In financial services, buy the platform when it is broken — and budget for the repair. Allied Capital and American Capital were both acquired at discounts to stated book value, both delivered scale, and both required years of repositioning that manifested as flat per-share book value rather than immediate accretion. The transferable lesson is that in asset-heavy financial institutions, the purchase price is only the down payment. The second installment is the operational restructuring, paid in time and equity drag. Ares Capital could absorb those costs because its parent manager stepped in to fund a portion directly—a luxury unavailable to most standalone acquirers.
2. Structure beats yield. The single most consequential decision in Ares Capital's history was not an acquisition, but its post-2009 portfolio shift out of mezzanine and second lien positions and into first lien and unitranche loans. That migration sacrificed headline yield in exchange for structural control. When a borrower defaults, the institution holding the entire debt stack dictates the restructuring; a junior creditor simply accepts the outcome. Underwriting to minimize loss-given-default rather than relying on low probability-of-default is less lucrative in quiet markets, but far more durable across a full credit cycle.
3. A tax structure is not a business model. Regulated investment company status eliminates corporate-level taxation and mandates high earnings payouts, preventing internal compounding. Because every business development company operates under identical tax rules, the structure explains why the sector exists, not why an individual firm outperforms. What truly separates Ares Capital from smaller competitors is its weighted average cost of debt—4.9% on roughly $16 billion in principal borrowing—a funding advantage driven by credit ratings, platform scale, and portfolio diversification rather than Subchapter M.2
4. Read the fee waiver, not the press release. The most revealing detail in the American Capital transaction was not the headline figure of $18.06 per share, but the external manager's commitment to waive up to $100 million in fees and contribute $405 million of its own cash.11 Managers confident in immediate earnings accretion rarely surrender contractually guaranteed income. Whenever an adviser voluntarily forfeits revenue, the size of the concession offers a clear gauge of the operational drag expected during portfolio integration.
5. Judge external managers by what they surrender, not what they say. Corporate statements on manager alignment cost nothing; contractual fee reductions do. Ares Capital's adviser has twice executed material economic concessions: the 2017 contribution and waiver package during the American Capital integration, and the 2019 base fee reduction on assets financed above 1.0x leverage.112 Concrete financial adjustments of this type provide measurable evidence of alignment, serving as the primary benchmark to monitor during future market stress.
6. Growth constrained by payout requirements forces discipline in one direction and dependence in another. Because a business development company cannot retain earnings, it must issue new equity or debt to fund expansion—and issuing shares below net asset value dilutes existing owners. That statutory limitation serves as a structural brake on ill-advised expansion, preventing management from funding poor investments out of retained cash. The corresponding weakness is an absolute reliance on capital market access. A company whose shares trade at a steep discount loses its expansion currency precisely when market dislocations offer the richest investment opportunities. Ares Capital's major acquisitions succeeded because the targets faced equity distress while Ares Capital maintained market access—proving that strategic timing in direct lending is a function of balance-sheet strength rather than market forecasting.
7. The most reliable moat in lending lies on the liability side, not the asset side. Investors often look for competitive advantage in underwriting quality, rigorous diligence, or workout expertise. While those factors matter—and have contributed to Ares Capital's net realized gains over two decades—they are claimed by every competitor and cannot be verified until credit cycles turn. By contrast, liability costs are continuously observable in public filings. A lender funding itself at a 4.9% weighted average interest rate competing against an institution borrowing at 6.0% can accept a lower yield on a higher-quality loan while achieving an identical return on equity. That structural funding advantage compounds quarterly without requiring market-timing skill. When evaluating levered credit platforms, credit ratings and borrowing costs reveal far more about long-term competitive durability than proprietary underwriting claims.
XII. Transcript & Conference Call Roadmap
For an investor tracking Ares Capital, four conference calls form the spine of the current operational narrative, with the most valuable signal emerging during analyst question-and-answer sessions rather than prepared remarks.
Q4 and full-year 2025, February 4, 2026. The call presented a complete operational snapshot: full-year core net investment income of $2.01 per share, a $29.5 billion portfolio, record gross originations of $15.8 billion, net leverage of 1.08x, accumulated spillover income of $988 million, and a $1 billion share repurchase authorization available if the stock trades below net asset value.14 Two elements offered specific forward guidance. Chief Financial Officer Scott Lem quantified an expected rate headwind, estimating that lower base interest rates would reduce earnings by roughly a penny per share in 2026—providing a concrete target against which subsequent performance can be measured.14 Meanwhile, President Jim Miller addressed questions regarding potential artificial intelligence disruption across the software book, citing an average borrower EBITDA of $350 million, a 37% loan-to-value ratio compared to 44% portfolio-wide, and a modest 1% to 2% allocation to annual-recurring-revenue loans.14 Management also reported average borrower interest coverage of 2.2 times, up year-over-year, challenging the widespread market assumption that coverage had deteriorated continuously through 2025.14
Q1 2026, April 28, 2026. This quarter marked the initial contraction in net asset value per share, which dropped 35 cents to $19.59 as GAAP net income fell to $0.13 per share against core EPS of $0.47 due to unrealized asset markdowns.15 Management disclosed an independent third-party AI risk evaluation of the software portfolio while reporting improving loan spreads and terms.15 Analyst questioning focused sharply on whether reported credit metrics fully reflected mark-to-market risk from AI disruption, alongside the refinancing risks facing weaker software holdings within financial sponsor portfolios.15
Q2 2026, July 29, 2026. On Kort Schnabel's fifth earnings call as Chief Executive Officer, credit normalization emerged as the central theme: non-accrual loans rose to 2.4% of cost across four new defaults, net asset value per share declined to $19.35, and core EPS of $0.47 fell slightly short of the $0.48 quarterly dividend.4 The analyst Q&A session yielded critical details on portfolio dynamics. Wells Fargo analyst Finian O'Shea and Citizens analyst Chris Muller pressed management on whether the non-accrual increase reflected broader cyclical trends or idiosyncratic portfolio issues; KBW analyst Paul Johnson questioned the claim that roughly 90% of payment-in-kind income was negotiated at origination; UBS analyst Melissa Wedel inquired about spread durability and the commercial paper program ramp; and RBC analyst Kenneth Lee sought clarification on remaining leverage capacity.13 Management provided direct, specific responses rather than broad evasions, giving investors clear data points to evaluate.
Q2 2025, July 2025 — Schnabel's first call as CEO. This call serves as an essential baseline for assessing executive continuity. A new chief executive's inaugural call establishes the reporting framework by which leadership is evaluated over time, showing which metrics are prioritized, which risks are acknowledged unprompted, and how dividend and leverage philosophies are framed before facing portfolio stress. Comparing that initial baseline against the second-quarter 2026 call—where non-accruals expanded, net asset value contracted, and core earnings fell just short of the dividend—offers a clear test of management's narrative consistency under pressure. Across the 2026 calls, the company's leverage targets, dividend messaging, and comparisons of current credit performance against long-term historical averages remained consistent.131514
What to watch generally. Prepared remarks reliably highlight commitment volume, dividend coverage, and credit performance relative to long-term historical averages. The Q&A sessions are where the tension between absolute levels and recent trends becomes visible. When management frames credit performance against a multi-decade mean while analysts focus on quarter-over-quarter deterioration, both perspectives rely on factual data—leaving investors to weigh trend direction against historical baselines.
Two specific operational indicators merit close attention on future calls. First, whether management continues to disclose the split between structural and workout payment-in-kind income proactively, or whether that detail must be prompted by analyst questions. Proactive disclosure of challenging metrics reflects management transparency, whereas reactive reporting signals shifting disclosure standards. Second, whether management utilizes the $1 billion share repurchase authorization.14 Buying back shares below net asset value is mechanically accretive to per-share book value; choosing not to execute buybacks when the stock trades near or below book value suggests a management preference for maintaining balance-sheet scale over optimizing per-share equity value.
XIII. Epilogue & Forward-Looking Radar
Twenty-two years after pricing its 11-million-share initial public offering, Ares Capital has distributed $35.24 per share in cumulative payouts and trades at roughly $19.92 against a book value of $19.35 per share—a modest premium indicating that equity markets still attribute value to the platform, albeit by a narrow margin.184
The strategic question for the next five years is not whether Ares Capital can deploy capital, but whether the intermediary direct-lending model can defend its profit margins. The structural advantages that enabled private credit to capture market share from commercial banks—permanent capital, swift execution, lack of public rating requirements, and single-lender hold capacity—apply equally to insurance companies and sovereign wealth funds. These institutional pools can originate loans directly, bypassing the BDC fee layer altogether. Ares Capital's defense rests on an origination network, workout capabilities, and sponsor relationships built over decades that cannot be purchased quickly with capital alone. That defense has held thus far, but it faces unprecedented pressure from deep-pocketed institutional entrants operating with lower cost-of-capital hurdles and no external management fee burdens.
A second structural challenge lies within the asset management industry itself. Major alternative managers recognized that permanent-capital credit vehicles generate recurring fee income on assets that never require redemption. This realization sparked rapid growth in non-traded perpetual BDCs, which raise capital continuously through private wealth channels to target the same middle-market borrowers. Whether the publicly traded BDC format—offering daily market liquidity and transparent pricing—maintains a long-term edge over the non-traded format's steady capital inflows remains an open question. To date, Ares Capital has maintained its position as the largest and lowest-cost operator among listed BDCs while its parent firm expands parallel non-traded strategies. While this dual track provides a coherent hedge for Ares Management, it does not necessarily insulate Ares Capital's public shareholders from yield compression.
A third macro force involves shifting bank regulation. Stringent post-crisis capital rules served as private credit's primary tailwind for fifteen years, driving commercial banks away from middle-market underwriting. That dynamic is not permanent. A loosening of bank capital requirements or an expansion of joint-venture partnerships between commercial banks and private credit managers could rapidly alter the supply of competing loan capital. Ares Capital cannot control these regulatory shifts, leaving its scale and funding cost advantage as its main line of defense. Investors projecting continued sector expansion must recognize the regulatory assumption underlying that growth thesis.
Three KPIs worth tracking, and only three.
1. Non-accruals as a percentage of amortized cost, quarter over quarter. This metric represents the most direct gauge of credit quality, reported each quarter alongside its fair-value equivalent. The spread between amortized cost and fair value is as critical as the top-line percentage: a widening gap signals that market prices or internal marks anticipate principal losses upon resolution. Investors should evaluate multi-quarter trends against management's stated long-term historical non-accrual average of roughly 3%.
2. PIK income as a share of total investment income. Reported separately as PIK interest and PIK dividends, this ratio reveals the proportion of revenue generated through non-cash accretion rather than cash receipts. A rising PIK percentage alongside increasing non-accruals indicates that borrower distress is being capitalized into debt balances rather than resolved. Conversely, a declining ratio during easing rate cycles would support management's assertion that PIK holdings reflect structural origination terms rather than loan workouts.
3. Core EPS versus the regular dividend. This single metric synthesizes net interest margins, credit losses, and advisory fee costs. Core EPS fully covered regular distributions through 2025 before trailing the quarterly dividend by one cent in the first two quarters of 2026, requiring spillover income to cover the shortfall.14154 While accumulated spillover income of $1.38 per share provides a multi-quarter liquidity cushion, it reflects past undistributed earnings rather than current portfolio earning power.
The final reflection. Ares Capital demonstrated that a public vehicle combining a 1980 statutory mandate with a pass-through tax structure could displace commercial banks as a primary source of middle-market corporate credit, navigating two major economic downturns intact. The historical record validates that operational execution. However, past performance does not guarantee permanent market power. The firm's remaining competitive advantages—borrowing cost efficiency, hold size capacity, workout infrastructure, and a manager historically willing to concede fees during integrations—represent advantages of degree rather than unassailable moats. These strengths face ongoing tests from institutional rivals with vast capital and fewer legacy fee structures, as well as portfolio headwinds marked by rising non-accruals, declining asset marks, and a sixth of investment income arriving in non-cash paper.
The coming years will determine whether this direct-lending empire was built on an enduring moat or a favorable market moment.
References
-
Ares Capital Corporation Announces Initial Public Offering — SEC Form 497AD, 2004-10-05 ↩↩↩
-
Ares Capital Corporation Annual Report on Form 10-K for the year ended December 31, 2025 — SEC EDGAR, 2026-02-04 ↩↩↩↩↩↩↩↩↩↩↩↩↩↩↩↩↩↩↩↩↩↩↩↩↩↩↩↩↩↩↩↩↩↩↩↩
-
Ares Management Corporation Reports Second Quarter 2026 Results — SEC Form 8-K Exhibit 99.1, 2026-07-29 ↩↩↩
-
Ares Capital Corporation Announces June 30, 2026 Financial Results and Declares Third Quarter 2026 Dividend — SEC Form 8-K Exhibit 99.1, 2026-07-29 ↩↩↩↩↩↩↩↩↩↩↩↩↩↩↩↩↩↩↩↩↩↩↩↩↩↩↩↩↩↩
-
Ares Capital Corporation Definitive Proxy Statement (Form DEF 14A) for the 2025 Annual Meeting — SEC EDGAR, 2025-03-28 ↩↩↩↩↩↩
-
Ares Capital Corporation Annual Report on Form 10-K for the year ended December 31, 2011 — SEC EDGAR, 2012 ↩↩↩↩↩↩↩↩↩↩↩↩↩↩
-
David Einhorn, "Fooling Some of the People All of the Time" — official book site ↩
-
Ares Capital Corporation to Acquire Allied Capital Corporation — SEC Form 8-K Exhibit 99.2, 2009-10-26 ↩↩↩↩↩
-
Ares Capital Corporation Completes Acquisition of Allied Capital Corporation — SEC Form 8-K, 2010-04-01 ↩
-
Ares Capital Corporation Annual Report on Form 10-K for the year ended December 31, 2018 — SEC EDGAR, 2019 ↩↩↩↩↩↩↩↩↩↩↩
-
Ares Capital Corporation Completes Acquisition of American Capital, Ltd. — SEC Form 8-K Exhibit 99.1, 2017-01-03 ↩↩↩↩↩↩↩↩↩↩
-
H.R.5473 — Small Business Credit Availability Act, 115th Congress — Congress.gov, 2018 ↩
-
Ares Capital Corporation Q2 FY2026 Earnings Call — BigGo Finance, 2026-07-29 ↩↩↩↩↩↩↩↩↩↩
-
Ares Capital (ARCC) Q4 2025 Earnings Call Transcript — The Motley Fool, 2026-02-04 ↩↩↩↩↩↩↩↩↩↩↩↩↩
-
Ares Capital (ARCC) Q1 2026 Earnings Call Transcript — The Motley Fool, 2026-04-28 ↩↩↩↩↩↩↩↩↩↩↩↩
-
Octus BDC Weekly Roundup: 31 Borrowers Added to Nonaccrual — Octus, 2026-05-11 ↩↩↩↩↩
-
Earnings call transcript: Ares Capital meets Q2 2026 EPS forecast — Investing.com, 2026-07-29 ↩↩↩↩
-
Ares Capital Corporation Investor Relations — Official Portal ↩↩↩
-
Ares Capital Corporation Appoints Kort Schnabel as Chief Executive Officer — SEC Form 8-K Exhibit 99.1, 2025-02-05 ↩↩↩↩↩
-
Ivy Hill Asset Management, L.P. — SEC Investment Adviser Public Disclosure (Form ADV) ↩
 LinkedIn
 WhatsApp
 Reddit
 Hacker News
 Email
Email Kindle
 RSS Feed
 Spotify
 Apple Podcasts
 Amazon Music
 Audible
 YouTube