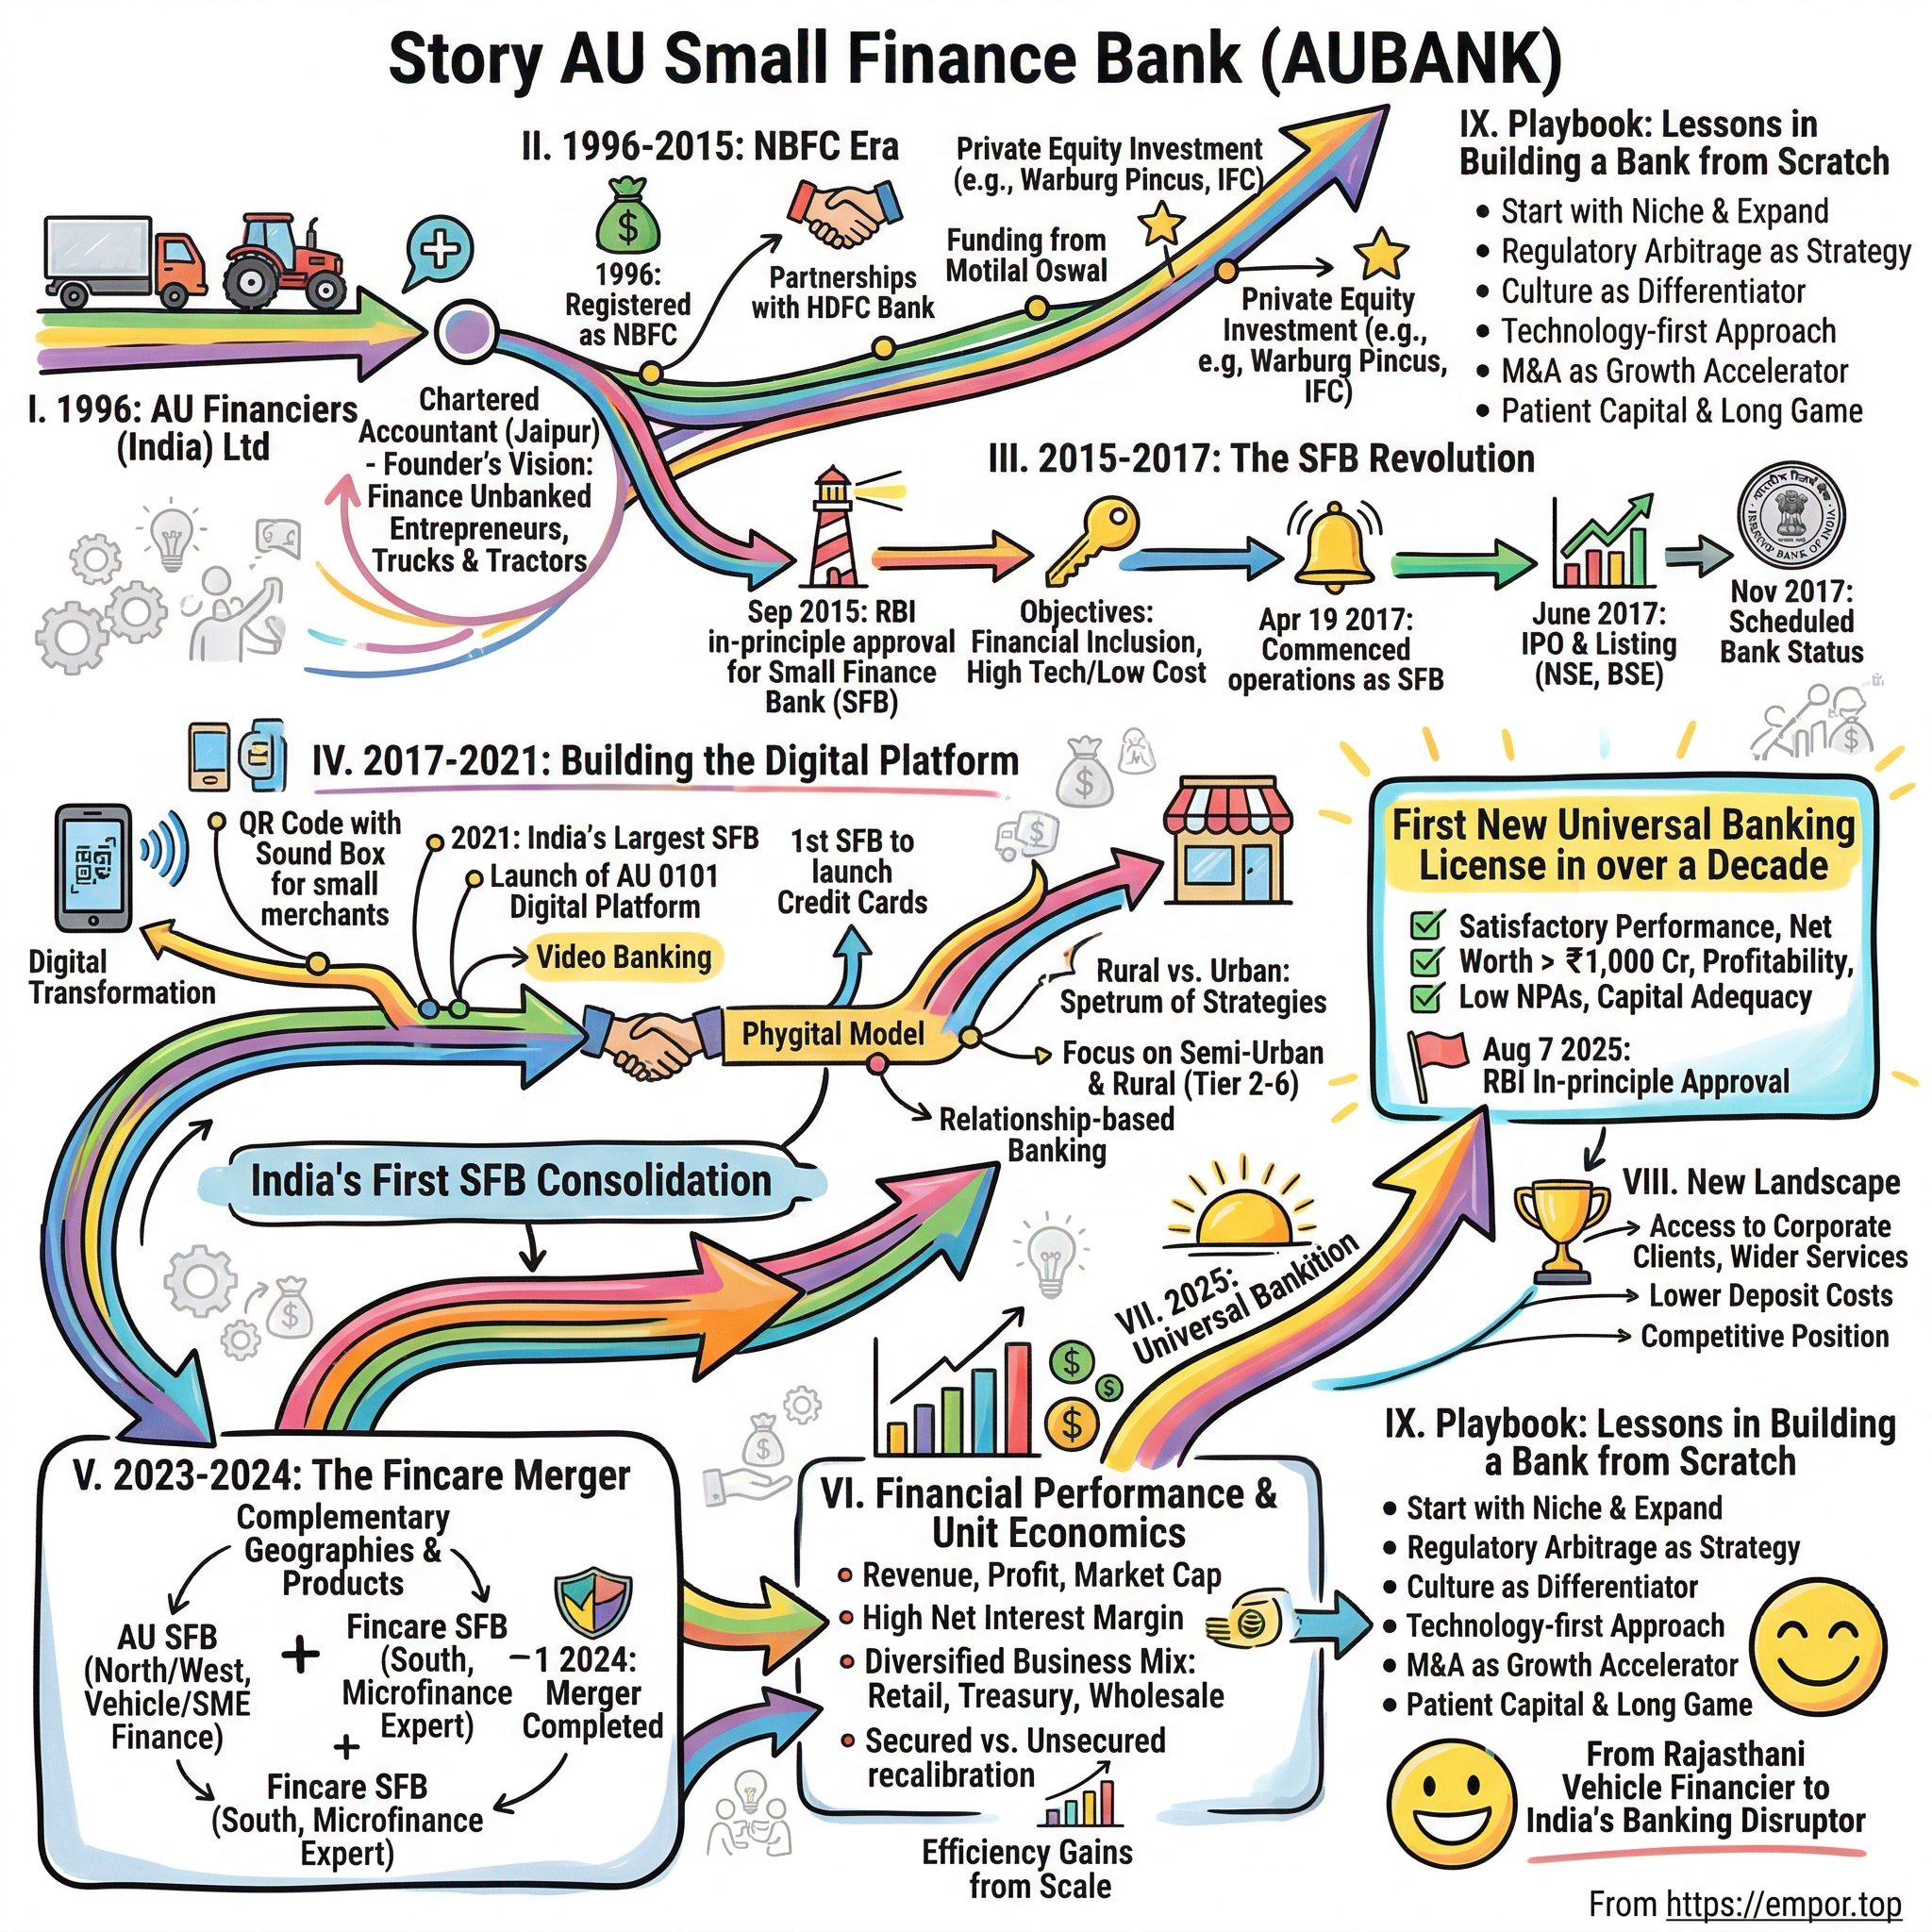
AU Small Finance Bank: From Rajasthan Vehicle Financier to India's Banking Disruptor
I. Introduction & Episode Roadmap
On the morning of August 7, 2025, a letter arrived at AU Small Finance Bank's corporate office on the fifth floor of Kanakia Zillion in Kurla West, Mumbai — a glass tower far removed from the industrial estate in Jagatpura, Jaipur, where the institution still keeps its registered head office. The letter came from the Reserve Bank of India, confirming that AU had received in-principle approval to transition into a universal bank.1
To an outsider, the announcement might appear as routine administrative housekeeping. To observers of Indian banking over the last decade, it marked a major structural shift. The RBI had not issued a fresh universal banking licence since 2014, when Bandhan Bank and IDFC Bank won approval. Ten small finance banks were created in 2015 to serve India's financially excluded populations, with the expectation that they would remain small, niche, and constrained to their designated segment.2 AU became the first allowed to exit that restricted framework.
The institution that received the RBI's approval was founded in Jaipur in 1996 by Sanjay Agarwal, a 26-year-old chartered accountant who turned down a conventional corporate career with, in the bank's account, "no institutional capital and no inherited influence."1 He began by extending commercial vehicle loans to small operators in rural Rajasthan — truck drivers, tractor owners, and three-wheeler operators whose cash earnings left no formal financial footprint. Three decades later, that business holds ₹1.58 lakh crore in deposits and ₹1.44 lakh crore in loans, with a balance sheet exceeding ₹1.9 lakh crore, 2,920 banking touchpoints across 21 states and four union territories, and more than 1.25 crore customers.3
The core question driving this story is whether a high-yield, deep-hinterland asset lender can transition into full-scale universal banking without compromising the credit discipline that enabled its growth.
That question reflects a specific structural dynamic. AU's economic engine relies on high-yield lending paired with elevated funding costs: in the quarter ended June 2026, it earned a 13.7% yield on gross advances against a 6.48% cost of funds.3 That gap generated a net interest margin near 5.9%, roughly double the margin of a typical corporate lender. Universal banking allows AU to compete for low-cost institutional deposits, government payroll accounts, and prime corporate credit — assets that lower funding costs but compress margins. The risk is trading a differentiated, high-margin niche for a low-margin struggle against established giants HDFC Bank, ICICI Bank, and Axis Bank on their home turf.
The narrative unfolds across five acts. Act I (1996–2015) details the non-banking financial company (NBFC) era, when AU developed an underwriting framework to evaluate unbanked borrowers. Act II (2015–2017) covers the small finance bank licensing process, operational restructuring, and initial public offering. Act III (2017–2023) examines branch expansion, product diversification, and a digital stack that has yet to yield expected operating leverage. Act IV (2023–2025) tracks the merger with Fincare Small Finance Bank — the sector's first consolidation — and its immediate exposure to a national microfinance credit stress. Act V (2025–2026) addresses the universal banking transition, regulatory holding-company requirements, and the bank's initiative to integrate artificial intelligence across operations.
Four analytical themes tie these phases together. First, regulatory laddering, as AU used successive regulatory licenses — from NBFC to small finance bank to universal bank — to reduce its cost of capital. Second, localised credit knowledge as a competitive moat, and whether that discipline survives rapid expansion and M&A. Third, the unit economics of high-yield retail lending funded by high-cost deposits, a spread-based model vulnerable to shifting market dynamics. And fourth, M&A integration under sector-wide stress, which has driven performance over the past two years.
The story begins where the credit gap originated: in an economy where the borrowers most in need of capital lacked the formal documentation required to secure it.
 Subscribe on LinkedIn
II. Pre-Banking Origins: The Vehicle Finance Engine (1996–2015)
Picture the economics of a commercial vehicle owner in rural Rajasthan in the late 1990s. Operating a single truck hauling marble from Kishangarh, cement, or grain, he was paid in cash on irregular schedules. Without salary slips, audited accounts, or formal bank statements, he was invisible to a state-owned bank's credit officer working from standard income-proof documentation forms.
Sanjay Agarwal's core insight was not that this borrower was inherently creditworthy, but that his creditworthiness could be observed directly rather than verified on paper. A lender could count daily trips, consult the dispatching transport agent, check with the truck dealer, and evaluate the vehicle's liquidation value. What looked like an absence of information to an underwriter in Delhi was a rich dataset to a team on the ground in Jaipur—it was simply a dataset gathered on foot.
AU Financiers (India) Limited was incorporated in Jaipur on January 10, 1996. Agarwal, a 26-year-old chartered accountant, was soon joined by Uttam Tibrewal, initiating an operating partnership that would oversee AU's retail lending for three decades.
The business did not start as a balance-sheet lender. From 2003, AU originated vehicle loans as a franchisee for HDFC Bank under a channel arrangement, moving to lend on its own books only from 2007.4
That distinction shaped its subsequent trajectory. For four years, AU sourced and underwrote loans that another institution funded and booked. It acquired distribution capabilities and credit assessment experience without carrying balance-sheet risk. When AU began direct lending, it was scaling an operational process it had already executed at scale—a rare advantage in retail lending, where institutions typically learn credit discipline by absorbing credit losses.
The niche and why it paid
The underlying business was unglamorous: commercial vehicles, multi-utility vehicles, three-wheelers, and tractors. Borrowers were concentrated in tier-3 to tier-6 towns, and underwriting relied on physical assessments of cash flows, local dealer relationships, and hard collateral in the vehicle itself. Two structural factors drove the economics.
The first was pricing power. Because formal institutions bypassed these borrowers, AU could charge interest rates in the mid-to-high teens without losing market share to competitors. That high yield created an earnings cushion capable of absorbing credit losses that would severely impair a prime corporate lender. The second was speed. A truck operator needing approval before a vehicle was sold cared far more about turnaround time than fifty basis points in interest. AU could approve loans in days while public sector banks took weeks. Convenience proved more valuable than price.
This dynamic highlighted a structural reality of Indian financial inclusion: profitability did not stem from offering cheap capital, but from ensuring capital availability. AU established its initial market position by being the lender that actually showed up.
The operational model differed sharply from tech-driven platforms. AU operated through small branch offices in regional towns, employing staff familiar with local transport contractors and local payment habits. When a borrower missed a payment, field officers managed collections in person rather than through remote call centers. While this high-touch approach increased operating expenses—a cost structure reflected in AU's expense ratios—it generated ground-level credit intelligence unavailable to underwriters analyzing screens in Mumbai.
Secured vehicle finance also carried an inherent structural alignment. When a truck operator defaulted, the lender was not chasing an unsecured obligation; the repossessed asset represented the borrower's livelihood. That dynamic explains why secured vehicle lending in India historically exhibits elevated delinquency during downturns alongside low ultimate credit losses: borrowers prioritize keeping their income-generating assets. Consequently, AU's asset quality remained tied primarily to macroeconomic variables—such as freight rates, diesel prices, and rural liquidity—rather than borrower intent.
Institutional capital arrives
By the late 2000s, this origination network had built a loan book capable of attracting institutional equity. Warburg Pincus invested in Au Financiers in 2012, joining the International Finance Corporation.5 In April 2014, IFC, Warburg Pincus, and ChrysCapital invested a combined $21 million, alongside Motilal Oswal's private equity arm as a new backer.6 Kedaara Capital followed with an investment in December 2014.7 By the time AU prepared its banking application, its assets under management reached ₹10,734 crore as of March 31, 2017.4
This institutional endorsement validated AU's asset origination and underwriting model. However, it did not solve the liability side of the balance sheet. Operating as a non-banking financial company (NBFC), AU funded its loan book by borrowing from commercial banks and wholesale debt markets at prevailing market rates.
Testing the moat: was the credit model actually all-weather?
The common narrative surrounding AU—that its collateralized, local underwriting model provided an all-weather credit moat—requires careful examination against its historical performance.
The clearest test of asset quality occurred during the COVID-19 pandemic, when AU operated as a licensed bank with full financial disclosures. Gross non-performing assets (NPAs) rose from 1.68% of gross advances to 4.25% as of March 31, 2021. Loans restructured under the Reserve Bank of India's resolution framework reached 1.8% of total advances—exceeding management's initial 1.5% guidance—and the bank built ₹278 crore in COVID-related provisions.8 These metrics reflected a cyclical, secured portfolio extended to cash-sensitive borrowers rather than an immune asset base.
The portfolio subsequently demonstrated strong recovery characteristics. By March 2026, gross NPAs fell to 2.03% and net NPAs to 0.74%.9 Over a full credit cycle, the portfolio exhibits a specific pattern: AU's secured book displays high sensitivity to macroeconomic shocks in reported asset quality, but achieves high recovery rates in ultimate credit losses because the underlying collateral retains value and directly supports the borrower's income. The primary investment risk is expecting flat credit costs through economic downturns.
The main vulnerability during AU's pre-banking era was not its asset underwriting, but its liability structure. Wholesale-funded NBFCs face systemic refinancing risk when debt markets tighten during economic stress. While AU could manage local credit defaults, it could not insulate itself from wholesale market liquidity freezes. Securing a banking license was therefore a strategic necessity to access stable retail deposits rather than a simple expansion milestone. In 2014, regulatory changes made that transition possible.
III. The Small Finance Bank Revolution & Public Debut (2015–2017)
Among the policy initiatives of Raghuram Rajan’s tenure as Reserve Bank of India Governor, the introduction of a differentiated banking framework proved particularly consequential. The underlying logic held that India's banking deficit was not a shortage of institutions, but a lack of lenders willing to serve smaller borrowers. Rather than attempting to persuade universal banks to expand down-market, the RBI created a licence category designed specifically for that customer base. Small finance banks were authorized to accept deposits and extend credit to small businesses, marginal farmers, and micro-enterprises through high-technology, low-cost operations.
Competition for the licences was intense. On September 16, 2015, the RBI granted in-principle approval to 10 entities out of 72 applicants. The successful applicants were Au Financiers, Capital Local Area Bank, Disha Microfin, Equitas Holdings, ESAF, Janalakshmi, RGVN (North East), Suryoday, Ujjivan, and Utkarsh.2
That cohort composition explains much of the sector's subsequent trajectory. Eight of the 10 successful applicants were microfinance institutions or MFI-adjacent lenders. AU was the primary outlier: a secured, collateralised vehicle and small-business lender entering a category dominated by unsecured group-lending platforms focused on women borrowers. When the microfinance sector faced systemic credit stress in fiscal year 2025, most members of the inaugural class suffered severe asset quality deterioration. AU operated from a distinct asset base and a different risk profile from the outset.
Rebuilding the plumbing
The transition from receiving an in-principle approval to launching banking operations required complete structural re-engineering. Between September 2015 and the issuance of its final licence in December 2016, AU overhauled its corporate structure, deployed a core banking platform, established treasury and compliance functions, implemented statutory reserve management, and recruited experienced retail bankers—a talent pool a regional vehicle financier had not previously required.
The operational shift went beyond technical infrastructure. AU's legacy field force was trained in loan origination and debt collection. Gathering deposits required persuading customers to entrust their savings to the institution—a distinct skill set and sales culture. AU commenced banking operations on April 19, 2017, and became a scheduled commercial bank in November 2017.4
The regulatory bargain was explicit. In exchange for accessing public deposits and RBI liquidity facilities, small finance banks accepted a 75% priority sector lending target—nearly double the 40% required of universal banks—and a requirement that at least half of the loan portfolio consist of loans below ₹25 lakh. AU traded pricing flexibility for liability stability. For a lender whose primary vulnerability had been wholesale funding risk, the trade secured stable funding, even as it meant operating within regulator-mandated portfolio boundaries for the next eight years.
The listing
On June 19, 2017, AU fixed its IPO price band at ₹355 to ₹358 per share.10 The issue was structured entirely as an offer for sale by existing shareholders, raising no fresh equity for the bank itself. Demand was strong across institutional and retail categories. On July 10, 2017, the shares listed on the BSE at ₹525 per share, representing a 47% premium to the issue price.11
The public listing served three key functions. First, it resolved a regulatory compliance requirement. Because the IPO was a secondary sale, early private equity investors sold down their stakes. The founding investor group's exit reduced foreign shareholding from roughly 65% to 49%, bringing the bank within ownership norms.12
Second, the listing established a strong valuation benchmark. The 47% first-day listing premium reflected investor confidence in an inclusion-focused lender operating with a banking licence. However, it also set high valuation expectations that the bank had to continually justify.
Third, the transition to a public company altered management incentives. Operating as a private NBFC allowed AU to compound quietly. As a listed bank, it became subject to quarterly public performance scrutiny, with founder Sanjay Agarwal holding a substantial equity stake subject to daily market valuation. Subsequent strategic initiatives—including branch expansion, entering the credit card market, and the eventual merger with Fincare—were executed under constant market observation.
Following the listing, AU's immediate priority was establishing a retail deposit franchise. While it possessed a licence to gather deposits, it lacked brand recognition outside Rajasthan, requiring a rapid expansion of its physical branch network.
IV. Phygital Platform & Product Expansion (2017–2023)
In retail banking, a lending brand and a deposit brand serve distinct functions. While borrowers prioritize capital access, depositors seek institutional stability built on physical presence, visible permanence, and established local relationships.
AU addressed this dynamic through a capital-intensive physical expansion. From 474 touchpoints as of March 31, 2018, the network grew to 2,626 across 21 states and four union territories by September 30, 2025, with total assets expanding from ₹18,833 crore to ₹1,65,542 crore over the same period.4 By June 2026, total touchpoints reached 2,920.3
Geographic diversification formed the second pillar of this expansion. Rajasthan's share of advances fell from 52% in March 2018 to 26% by September 2025.4 While this reduced single-state concentration risk, regional exposure remained concentrated, with the top three states accounting for 55% of the gross loan portfolio and 56% of deposits as of September 30, 2025.4
Sprawl, with a purpose
Product expansion targeted customer relationship depth rather than immediate balance-sheet gains. AU expanded beyond its core vehicle finance business into secured business loans for micro, small, and medium enterprises, home loans, commercial banking, agricultural finance, gold loans, personal credit, and credit cards. By the quarter ended June 2026, retail secured assets—comprising vehicles, mortgages, and gold—represented roughly 67% of the portfolio, while commercial banking accounted for 23%.13
The strategic rationale relied on cross-selling to improve retention and lower deposit acquisition costs. However, entering diverse asset classes introduced distinct underwriting requirements, testing the bank's risk discipline outside its core vehicle finance expertise.
Brand strategy during this period operated primarily as a deposit-gathering tool. AU invested heavily in marketing across new geographic markets to build brand recognition among depositors. Concurrently, the bank offered premium deposit rates to attract capital—a strategy that successfully built liabilities but established a higher baseline cost of funds that persists until brand equity can replace rate incentives.
The digital layer
AU's technology architecture combined digital acquisition channels with its physical branch network.
In 2021, following the Reserve Bank of India's authorization of video-based Know Your Customer compliance, AU introduced 24x7 video banking within its AU 0101 mobile application. This capability enabled account opening and remote service delivery without physical branches. By the quarter ended June 2026, over 90% of the bank's transactions and service requests were processed digitally through AU 0101.3 The bank also deployed merchant soundboxes and updated its brand positioning—transitioning from "Chalo Aage Badhein" to "Badlaav Humse Hai" and, by FY26, "Soch Badlo aur Bank Bhi," supported by promotional campaigns featuring actors Ranbir Kapoor and Rashmika Mandanna.9
Testing the operating leverage claim
Despite high digital transaction volumes, the technology stack has not yet demonstrated significant operating leverage in the bank's cost structure.
AU's cost-to-income ratio stood at 59.2% in the quarter ended March 2026, compared to 59.7% in the December 2025 quarter.9 This remains elevated relative to the 54.4% reported in the December 2024 quarter.14 Nine years after securing its banking licence, AU's cost-to-income ratio has not established a downward trajectory, remaining above the high-30% to mid-40% range typical of larger private sector peers.
In financial disclosures, management has emphasized cost-to-assets as its primary efficiency benchmark, which improved to 4.1% in FY26 from 4.3% in FY25.9 While cost-to-assets provides a relevant metric for a rapidly expanding balance sheet, the emphasis shift coincides with an increasing cost-to-income baseline.
AU's digital infrastructure has expanded customer acquisition and service reach without delivering measurable operating leverage to date. Management has tied future productivity gains to artificial intelligence initiatives, allocating approximately ₹1,000 crore annually to technology—representing 12% to 13% of operating expenses—with the objective of scaling operations without proportional cost growth.139
V. The Fincare Merger: Scale vs Microfinance Credit Shock (2023–2025)
On October 29, 2023, the boards of AU Small Finance Bank and Fincare Small Finance Bank approved an all-stock scheme of amalgamation. Under the agreed terms, Fincare shareholders received 579 AU shares of ₹10 face value for every 2,000 Fincare shares held, leaving Fincare's existing owners with roughly 9.9% of the combined institution.15 It marked the first consolidation between two small finance banks in India—a licence category eight years old that had not previously seen a merger between its members.
The strategic rationale appeared compelling on paper. As of December 31, 2023, Fincare brought a gross loan portfolio of ₹13,352 crore, deposits of ₹9,734 crore, more than 59 lakh customers, and over 14,800 employees.16 Critically, it added southern distribution. While AU's network was concentrated in northern and western India, Fincare operated extensively in Karnataka, Tamil Nadu, and Andhra Pradesh. It also introduced an asset class AU had never managed: microfinance.
AU framed the transaction as a revenue-synergy play rather than a cost-cutting exercise, describing it as creating "a superior platform, benefitting from efficiencies of size and scope."17 The Reserve Bank of India approved the amalgamation in March 2024, with an effective date of April 1, 2024.18 Rajeev Yadav, Fincare's managing director and chief executive, joined AU as Deputy CEO on March 31, 2024.19
Management's initial targets were ambitious. In April 2024, days after the merger took effect, Sanjay Agarwal publicly announced that AU was targeting roughly 25% annual growth over the following three years, aiming to double its balance sheet to ₹2.5 lakh crore by the time it completed a decade as a bank.20
The structural design of the deal shaped its subsequent fallout. Because it was an all-stock transaction, AU paid with its own equity when its valuation was elevated and Fincare's microfinance book was generating peak returns. Unlike a cash acquisition with a fixed purchase price, an all-stock deal leaves acquirer shareholders continuously exposed to target risks. When the microfinance sector subsequently deteriorated, AU's shareholders did not absorb a one-time valuation adjustment; they absorbed two years of elevated credit losses on an asset class permanently integrated into their balance sheet.
The wall
The microfinance cycle turned within months of closing. Industry-wide borrower over-leveraging—caused by multiple lenders extending uncoordinated credit to the same households—triggered a broad wave of delinquencies unrelated to any individual lender's underwriting standards.
AU's financial disclosures reflected this deterioration in real time. During an earnings call on January 24, 2025, management disclosed that the inclusive finance portfolio stood at roughly ₹7,400 crore—about 7% of total gross loans—with microfinance accounting for ₹7,150 crore. Microfinance gross NPAs had reached 4.1%, accompanied by a special mention account (SMA) pool of 4.4%. Annualised credit costs on the microfinance portfolio ran at 5.4% through the first nine months of FY25.21
Stress in the credit card book was even more pronounced, prompting direct management acknowledgment. The digital retail unsecured portfolio—encompassing credit cards and personal loans—totaled about ₹4,000 crore, or roughly 4% of total advances, with year-to-date annualised credit costs reaching 9.2%. On the call, management identified specific execution errors: "we got a few things wrong, which included not getting digital underwriting correct, higher reliance on card-for-card sourcing, and issuing higher credit limits," noting that performance trailed industry peers.21
When analyst Kunal Shah of Citi inquired whether credit card credit costs exceeding 10% would persist into the fourth quarter, Agarwal confirmed they would.21 In response to Madhuchanda Dey of MCPro regarding whether these losses would force AU back to its traditional core, Agarwal acknowledged that the bank "might have made some mistake in building up the credit card," framing the losses as manageable learning expenses while asserting that building a comprehensive banking franchise required mastering unsecured lending.21
For FY25 as a whole, net profit rose to ₹2,106 crore, but credit costs climbed to 1.30% of average assets, while return on total assets moderated to 1.48% from 1.54% in FY24, driven by microfinance provisions and interest income reversals.4
The retreat, and what it proved
Management responded with swift operational adjustments. Microfinance exposure was reduced from 7.3% of the total loan book in September 2024 to 5.0% by September 2025.4 Sourcing shifted heavily toward the government-backed Credit Guarantee Fund for Micro Units (CGFMU) scheme—which mitigates risk weights and credit losses—increasing coverage from 60% of quarterly disbursements in December 2024 to 96% of the entire microfinance portfolio by June 2026.213 Concurrently, the bank rebuilt its overall secured loan share to 92% by September 2025, committing to cap unsecured lending at roughly 10% over the medium term.4
Financial metrics began recovering in FY26. Credit costs declined to 0.96% of average assets from 1.30%, net profit increased 25% to ₹2,641 crore, and gross NPAs improved to 2.03%.9 By the quarter ended June 2026, collection efficiency for non-overdue microfinance loans reached 99.7%, quarterly slippages fell 22% year-on-year, and management projected microfinance credit costs, including guarantee fees, to settle around 2.5%—below earlier guidance of 3%.9313 Core banking system integration for Fincare was completed in the March 2026 quarter, concluding technical consolidation two years after legal merger completion.9
The calibrated verdict
Evaluating the merger requires separating strategic intent from execution outcomes. The initial premise held that acquiring Fincare would deliver high-yield diversification without impairing balance sheet health. The historical record refutes that seamless transition. AU absorbed two years of elevated credit costs and margin compression on a portfolio acquired near the top of its credit cycle, leading to return-on-asset dilution and a strategic contraction from the acquired asset class within nine months.
Leadership continuity also presented challenges. Rajeev Yadav—who joined as Deputy CEO to oversee integration and technology deployment—resigned effective October 31, 2025, and subsequently assumed the chief executive role at another institution by April 2026.1922 Retaining target leadership through post-merger stabilization is a key indicator of integration success, marking an area where execution fell short of design.
What remains intact is the physical distribution network that AU could not have rapidly developed organically: a southern branch footprint, an expanded customer base, and priority-sector-eligible lending capacity that supports regulatory compliance. On the January 2025 call, management noted that Fincare contributed roughly 1,200 touchpoints—including about 800 microfinance branches concentrated around sub-district headquarters—providing physical infrastructure that can be repurposed for deposit gathering and secured retail lending.21 A rating assessment by CARE Ratings highlighted that while the transaction provided access to southern markets for geographic diversification, meaningful scale-up in those regions remained work in progress.4
Ultimately, AU acquired regional physical reach at the expense of temporary credit stress and earnings dilution. The long-term success of the transaction hinges on whether these southern branches can originate stable, low-cost retail deposits. The key metric evaluating this transition remains the proportion of AU's total deposit base sourced from southern states—a figure not prominently broken out in financial disclosures.
VI. Financial Performance, Unit Economics & Business Mix
At its core, a bank's financial performance rests on a fundamental equation: asset yields minus funding costs, operating expenses, and credit losses. AU Small Finance Bank presents an atypical spread model that clarifies both its premium market valuation and the ongoing debate between bullish and cautious investors.
What AU earns. Yield on gross advances stood at 13.7% in the quarter ended June 2026, down from 14.1% a year earlier.3 For context, large private sector banks lending primarily to prime corporate and salaried retail borrowers generate significantly lower yields. AU achieves this elevated return by extending collateralized loans to unbanked and underserved borrowers in under-penetrated regional markets where competitive intensity remains low.
What AU pays. The bank's cost of funds was 6.48% in the June 2026 quarter, down 60 basis points year-on-year.3 While this reduction represents a key driver of recent profitability, it resulted partly from broader monetary policy easing. On AU's July 2026 earnings call, management acknowledged that its cost of funds had "effectively bottomed out."13
The spread that results. Net interest margin reached 5.9% in the June 2026 quarter, up 47 basis points year-on-year.3 For full-year FY26, net interest margin registered at 5.65%, down from 5.94% in FY25—underscoring that quarterly spikes do not necessarily reflect the annualized run rate.9 Nevertheless, a margin near 6% is nearly double the average of major universal banks, forming the foundation of AU's investment thesis.
What it costs to run. Maintaining a high-yield, high-touch, branch-intensive distribution model carries significant operational overhead. Operating expenses reached ₹1,949 crore in the June 2026 quarter, rising 26% year-on-year—outpacing growth in both loans and deposits.3 For full-year FY26, operating expenses totaled ₹7,002 crore, consuming the majority of net revenue.9
What it loses. Credit costs improved to 0.8% of average total assets in the June 2026 quarter from 1.4% a year earlier, and to 0.96% for FY26 from 1.30% in FY25.39
Combining these dynamics yields the bank's core return profile: return on assets reached 1.6% and return on equity stood at 14.2% for FY26, improving to an annualized 1.7% and 15.6% in the June 2026 quarter.93 Net profit rose 25% to ₹2,641 crore in FY26, generating earnings per share of ₹35 against a book value per share of ₹267.9
What the mix tells you
Following the microfinance stress in FY25, management deliberately rebalanced the loan portfolio toward secured assets. As of the June 2026 quarter, retail secured assets—comprising vehicle loans, mortgages, and gold loans—represented roughly 67% of total advances at ₹96,485 crore, reflecting a 22.5% year-on-year increase. Commercial banking accounted for approximately 23% of the portfolio at ₹32,789 crore, expanding at a faster 33.8% rate, while rural assets grew 38% to ₹17,716 crore.13 Overall secured lending expanded 25% year-on-year, whereas unsecured loans—encompassing microfinance, credit cards, and personal loans—grew by 11%.3
Two analytical conclusions emerge from this shift. First, AU's earnings recovery is propelled by secured asset expansion and normalizing credit costs rather than the high-yield unsecured portfolio envisioned as the prime growth driver of the Fincare merger. Second, commercial banking has become the fastest-growing division, bringing lower yields alongside tighter credit standards. While both strategic choices enhance balance sheet resilience, they also exert downward pressure on net interest margins over time: expanding lower-yielding segments faster than high-yield books systematically compresses spreads toward universal banking peer averages.
The balance sheet, and its cushions
Capital adequacy stood at 18.9% as of June 30, 2026, with Tier-1 capital at 17.1%.3 While this remains comfortably above the 15% minimum statutory requirement for small finance banks, capital buffers are crucial given the capital consumption inherent in universal banking conversion and sustained 20%-plus loan growth. The trajectory shows gradual compression, down from a capital adequacy ratio of 20.06% in March 2025 and 18.78% in September 2025.4 Although current reserves remain adequate, CARE Ratings has cited a sustained drop in capital adequacy below 17% as a potential rating downgrade trigger.4
Asset quality metrics showed gross non-performing assets at 2.10% and net NPAs at 0.76% as of June 2026.3 The provision coverage ratio stood at 85% when including technical write-offs, but dropped to 64% when excluding them.13 While such divergence is common in Indian retail banking, the lower figure offers a more conservative measure of existing provisions against recognized non-performing loans.
Liquidity buffers remained sound, with the average liquidity coverage ratio at 119%; management noted that the bank holds an additional 10% to 15% in high-quality non-statutory liquidity ratio (non-SLR) instruments outside the LCR calculation.3 Total deposits reached ₹1,57,727 crore, representing 24% year-on-year growth, compared to gross advances of ₹1,44,250 crore, which grew 23%.3
The one number that constrains everything
The current and savings account (CASA) ratio—the proportion of low-cost demand deposits supporting a bank's liability structure—stood at 29% of total deposits in the June 2026 quarter.3 CARE Ratings highlighted this as a structural vulnerability, noting that AU's CASA ratio "remains lower than that of mid-sized private sector banks, resulting in a relatively higher cost of funds."4
This dynamic represents the central structural constraint of AU's business model. To attract deposits without the established brand equity of major incumbents like HDFC Bank, AU offers higher interest rates, elevating its overall funding costs. To maintain net interest margins, the bank must originate higher-yielding loans to less seasoned or under-banked borrowers, exposing the balance sheet to higher credit volatility during downturns. The high-yield asset strategy and high-cost liability structure are codependent elements of the same financial model. Universal banking is, at bottom, an attempt to break that loop.
Against shareholders' funds of ₹20,885 crore as of June 2026, AU commanded a market capitalization of approximately ₹82,000 crore in late August 2026, with shares trading around ₹1,091 on the National Stock Exchange against a 52-week range of ₹682 to ₹1,144.323 Equity markets continue to value the institution at a substantial premium to book value for a business generating a mid-teens return on equity. That valuation premium reflects an expectation of future structural transformation—specifically, whether universal banking can lower funding costs without eroding credit quality, a topic examined in the final section.
VII. The Universal Banking Frontier & Regulatory Navigation (2025–2026)
AU submitted its application on September 3, 2024, under the RBI's 2016 on-tap licensing guidelines and the April 2024 framework allowing small finance banks to voluntarily convert.1 Eleven months of regulatory review followed before the RBI granted in-principle approval on August 7, 2025—valid for 18 months and marking the first such conversion permitted for a small finance bank.1
The bank's press release framed the decision as a landmark moment "that will go down in India's banking history," while founder Sanjay Agarwal's statement cited the Prime Minister, Viksit Bharat 2047, and declared that "AU is not just a bank — AU is a mission."1 Investors, however, should distinguish promotional rhetoric from operational reality: the announcement marked a founder's 30-year milestone and a marketing push for depositors. The approval is a milestone, but it grants permission to execute a strategy rather than proof of success.
The holding company fight
The in-principle approval contained a key constraint: the RBI required promoter shareholding in the converted bank to be held through a Non-Operative Financial Holding Company (NOFHC). Designed to isolate the bank from group entities, the structure creates tax friction for promoters and often leads equity markets to apply a holding-company valuation discount.
AU petitioned the central bank to reconsider the condition. In a letter dated March 6, 2026, the RBI modified its stance, ruling that an NOFHC would be required only if the bank or its promoter group establishes new financial group entities in the future.249 AU subsequently submitted its final universal banking licence application in March 2026 and, as of late August 2026, is awaiting final regulatory approval.9
This regulatory shift carries dual implications. Positively, it demonstrates a regulator willing to adapt structural rules where they do not serve an immediate prudential purpose, removing an overhang on promoter equity. Less comfortably, it shows a regulated entity successfully lobbying to relax a licence condition, primarily benefiting the promoter's shareholding structure. Both interpretations reflect realistic aspects of regulatory navigation in Indian banking.
The broader context explains the central bank's compromise. The NOFHC mandate stemmed from past industry failures where conglomerate-backed banks funnelled capital into parent group entities. As a standalone lender without parent group operations, AU argued that mandatory holding company insertion created unnecessary cost. The RBI preserved the requirement as a future tripwire while eliminating immediate friction—a pragmatic regulatory outcome that also establishes a precedent for subsequent small finance bank applicants.
What actually changes
Converting to a universal banking licence removes structural constraints. AU sheds small finance bank portfolio restrictions—specifically the mandate requiring half its loan book to consist of loans below ₹25 lakh—and secures a phased transition to align its priority sector lending target with standard universal bank norms. The licence also opens access to institutional business previously off-limits, including government payroll accounts, large corporate deposits, and broader treasury operations.
However, the operational impact is more nuanced than the regulatory checklist suggests. Universal banking does not automatically lower AU's cost of funds. It only removes the regulatory reason AU cannot compete for cheap deposits. Institutional treasury managers select deposit counterparties based on credit ratings, settlement infrastructure, relationship depth, and counterparty risk. AU's long-term debt carries AA/Stable ratings from CRISIL, CARE, and ICRA, while its fixed deposits are rated AA+/Stable.3 While solid, these ratings fall short of the AAA ratings held by major private sector incumbents, accounting for the persistent gap in borrowing costs. A new licence does not instantly close that pricing gap; years of operational stability might.
The risk nobody markets
The transition also introduces strategic risks that management rarely highlights. AU built its initial franchise by serving unbanked and under-banked borrowers willing to pay higher interest rates for accessible credit. Universal banking pushes AU into prime corporate lending—a market where it lacks pricing power and must compete against established institutions with lower funding costs, larger balance sheets, and standing corporate relationships.
Capturing share in prime corporate banking often requires aggressive loan pricing, risking margin compression or under-priced credit risk. Conversely, failing to gain traction leaves the bank absorbing transition costs—compliance overhead, IT infrastructure, priority sector realignment, and brand repositioning—without generating corresponding revenue gains.
During the July 2026 earnings call, management offered a more grounded outlook than its initial announcement, targeting compound loan growth of 2.0 to 2.5 times India's nominal GDP over the next decade. Management set its return on assets target at roughly 1.8%—about ten basis points above the June 2026 quarter annualized level—specifying that efficiency gains and credit cost normalization would drive profitability "rather than NIM expansion."13 Management is telling investors that margins do not go up from here. Financial models assuming spread expansion overlook management's own guidance.
The universal banking licence provides strategic optionality accompanied by structural costs. Long-term execution will determine whether that option yields sustained value.
VIII. Management, Governance & Capital Allocation Audit
Sanjay Agarwal is a distinctive figure in Indian banking. The key distinction is not his founding story—India has produced many first-generation financial entrepreneurs—but his tenure. Three decades after launching the institution, he continues to run it with a personal stake large enough that his net worth remains a heavily leveraged position on AU's book value.
Per the bank's 2026 shareholding disclosures, Agarwal held roughly 15.7% of the equity personally, with total promoter and promoter group holdings—including family members—standing at about 22.8%.25 Founder ownership at that level provides genuine alignment: few executives lose more than Agarwal if credit quality deteriorates. However, it also concentrates decision-making authority, making accountability and governance two sides of the same coin. The institutional shareholder base sitting alongside him remains heavily foreign—a legacy of its private equity rounds—leaving AU's share price exposed to global capital flows distinct from the economic health of regional vehicle operators.
His public stance is equally candid. On earnings calls, Agarwal openly discusses management errors in a manner uncommon among Indian bank chief executives, describing credit card losses as a "learning cost" and conceding that AU's card performance had been "worse than the industry leaders."21 That candour offers analytical value, as a management team that publicly owns its missteps is easier to underwrite than one that blames external factors. Yet candour is not proof of sound judgment: acknowledging a mistake and avoiding the next one require different operational capabilities.
Continuity, and its recent turnover
The Reserve Bank of India approved Agarwal's reappointment as Managing Director and CEO for a further three-year term effective April 19, 2026—the ninth anniversary of AU commencing banking operations.9
However, executive leadership around him has seen significant turnover within a narrow window. Uttam Tibrewal, Agarwal's co-founder and long-time operating partner, completed his term as a Whole Time Director on April 18, 2026; while he continues to lead retail business verticals with a focus on field engagement, he no longer serves on the board.9 Rajeev Yadav, brought in as Deputy CEO to oversee the Fincare integration, resigned effective October 31, 2025.19 Vivek Tripathi, previously Chief Credit Officer, became an Executive Director on April 24, 2026. Gaurav Jain was appointed Chief Financial Officer effective April 27, 2026, and Yogesh Jain, previously Chief Operating Officer, was elevated to Deputy CEO on July 25, 2026.93
Management has framed these changes as deliberate succession planning aimed at building "professional leadership in perpetuity" through distributed governance.13 That rationale is plausible, as a bank transitioning to universal status requires deeper institutional management beyond a founder-led model, and promoting internal talent is a positive signal. Nonetheless, the volume of senior leadership changes within eighteen months—a departing Deputy CEO, a co-founder stepping off the board, alongside a new CFO, Executive Director, and Deputy CEO—represents substantial turnover. For an institution simultaneously integrating an acquisition, managing credit recovery, and executing a licence conversion, this shift belongs on the risk watchlist rather than the achievement ledger.
Guidance versus outcomes
Assessing a management team requires evaluating past guidance against actual outcomes. AU provides a clear case study.
In April 2024, immediately following the Fincare merger, Agarwal stated publicly that AU targeted doubling its balance sheet to ₹2.5 lakh crore by April 2027—its tenth anniversary as a bank—requiring roughly 25% annual growth over three years.20 As of June 30, 2026, total assets reached just over ₹1.9 lakh crore.3 Reaching ₹2.5 lakh crore by April 2027 would require roughly 30% balance sheet growth in a single year, well above the 23% to 24% rate recorded recently.
On its current trajectory, that headline growth target will likely be missed. While the shortfall reflects a difference in degree rather than an operational failure, the target was established at the peak of post-merger optimism, when guidance is typically least reliable. Investors should treat AU's headline growth targets as aspirational framing rather than commitments, focusing instead on granular operational guidance—such as credit cost corridors, cost-to-assets trends, and its 1.8% return-on-assets target—which has proven better calibrated. For instance, on the January 2025 earnings call, management guided full-year FY25 credit costs to between 1.55% and 1.60%; the actual outcome came in lower at 1.30% of average assets.219 Issuing conservative guidance during a period of credit stress and beating it represents a more constructive signal.
A second test highlights the limits of single-variable targets. On the January 2025 earnings call, Agarwal indicated that reaching a 2% return on assets depended primarily on a 50-basis-point drop in funding costs.21 Cost of funds subsequently fell 60 basis points year-on-year.3 However, annualized return on assets stood at 1.7%, not 2%. The specified condition was satisfied, but the projected outcome was not achieved—a reminder that single-variable financial targets rarely remain intact when broader operating conditions shift.
Governance texture
CARE Ratings reports a 12-member board comprising nine independent directors, including two women directors, supported by a board-level Sustainability Committee conducting quarterly ESG reviews.4 The rating agency also highlights cybersecurity, customer data privacy, and product mis-selling as social risks that "remain a key monitorable"—standard operational risks for a rapidly expanding retail bank, but particularly relevant for an institution that added a net 334 touchpoints in FY26 alone and employs over 58,400 people.493
The bank declared a dividend of ₹1 per share for FY26—representing 10% of face value, a modest payout against reported earnings of ₹35 per share.9 For a lender expanding its loan book at over 20% annually while preparing for universal banking conversion, retaining capital represents a prudent allocation strategy rather than an income distribution choice.
IX. Competitive Moats & Structural Analysis
Stripping away the narrative raises the fundamental strategic question: what, specifically, prevents competitors from replicating AU's business model?
Helmer's 7 Powers, applied honestly
Process Power represents AU's strongest genuine moat. The ability to underwrite a truck operator or small shopkeeper lacking formal income documentation in a tier-4 town—at pricing that absorbs credit loss rates—relies on institutional knowledge embedded in local staff, field relationships, and operating practices rather than a replicable credit algorithm. Built over three decades, this operational discipline cannot be easily acquired. The evidence of its existence appeared during the FY25 microfinance shock, when AU's secured portfolio remained stable while its acquired unsecured book deteriorated—as Agarwal noted, "if you move away from this 10% of our book, the 90% book is well in control."21 However, this capability remains strictly bounded: process power in secured vehicle and small business lending did not translate to credit cards, where management acknowledged underperformance relative to industry leaders.21 Process power is domain-specific, and AU possesses it within a single domain.
Scale Economies are emerging but remain indecisive. Expanding to 2,920 touchpoints and a ₹1.9 lakh crore balance sheet spreads fixed technology and corporate overhead more thinly than when the bank managed a ₹20,000 crore balance sheet.3 Yet cost-to-income metrics demonstrate that these scale benefits are currently being absorbed by expansion expenses rather than accruing as margin expansion. Relative to incumbent giants HDFC Bank or ICICI Bank, AU remains a minor operator at roughly one-tenth their balance-sheet size. Scale economies function as a competitive power relative to direct rivals, and AU does not possess scale advantages over the universal banks it now seeks to challenge.
Counter-Positioning provided a historic advantage that is steadily eroding. Offering premium deposit rates alongside video-based onboarding initially attracted depositors from incumbents who could not match higher rates without diluting their existing low-cost deposit bases. However, video-based KYC compliance has become an industry standard, high-yield digital deposit offerings are widely available across small finance banks and fintech platforms, and major incumbents have upgraded their digital applications. A strategy that served as a counter-positioning wedge in 2021 has become a standard industry feature by 2026.
Cornered Resource is the claim most frequently advanced regarding AU's position—specifically that first-mover status in converting to a universal banking licence constitutes an exclusive asset. That thesis warrants scepticism. The RBI's April 2024 conversion framework remains accessible to any qualifying small finance bank, with peers such as Jana Small Finance Bank and Ujjivan Small Finance Bank pursuing the same regulatory pathway. AU's advantage consists of an operational head start measured in quarters rather than a permanent structural exclusion of competitors. Regulatory approval is distinct from commercial execution: the licence converts into a strategic asset only if AU translates it into materially lower funding costs. Given the bank's track record of converting strategic milestones into economics—such as a digital platform yet to yield cost leverage and a credit card venture that produced losses before profits—crediting the licence as a cornered resource remains premature.
Porter's five forces
Bargaining power of depositors: high. This requirement represents the binding constraint on AU's financial model. Indian retail depositors remain highly rate-sensitive and increasingly mobile across digital platforms. AU must offer a rate premium over major incumbent banks to attract and retain deposits, placing a structural ceiling on net interest margin expansion—a dynamic highlighted by CARE Ratings' continued focus on the bank's 29% CASA ratio.4
Rivalry: high and two-sided. On the asset side, AU faces vehicle finance competition from non-bank specialists Cholamandalam Investment and Finance and Shriram Finance, which operate with identical local underwriting expertise without carrying banking compliance overheads. In mortgages and MSME lending, it competes against both specialized NBFCs and established private banks. On liabilities, it competes against universal banks benefiting from lower funding costs. Operating under dual margin pressure defines AU's competitive position.
Threat of substitutes: moderate. Digital lenders and UPI-based platforms are increasingly disintermediating small-ticket merchant and consumer credit with lower customer acquisition costs. However, these platforms cannot accept retail deposits, preserving AU's core structural protection and justifying its banking licence. Substitution risks remain active at the product margin but constrained at the franchise level.
Threat of new entrants: low. Banking licences represent the highest regulatory entry barrier in Indian financial services. This barrier offers AU its most decisive protection, derived entirely from central bank regulation rather than corporate strategy.
Bargaining power of borrowers: moderate and rising. Historically, AU's target borrowers possessed few formal credit alternatives. As formal banking reaches deeper into tier-3 and tier-4 regions and credit bureau coverage expands, those borrowers gain competitive options, resulting in yield compression. Yield on gross advances declined 40 basis points year-on-year from 14.1% to 13.7%.3 While a 40-basis-point drop does not signal a crisis, it marks an established structural trend.
The peer frame
Locating AU within its competitive landscape requires evaluating three distinct peer groups. Relative to the small finance bank cohort from which it originated, AU no longer operates as a peer: it commands a balance sheet several times larger than most cohort members, holds the sole universal banking in-principle approval, and maintains a portfolio dominated by secured assets while peers remain microfinance-concentrated. Relative to specialist NBFCs competing for similar assets, AU carries banking compliance costs but funds itself through retail deposits rather than wholesale debt—a structural advantage during credit tightening and a cost handicap during benign liquidity cycles. Relative to major private banks, AU operates at one-tenth their size, pays higher funding costs, and earns nearly double their net interest margins.
That final comparison defines the strategic trade implicit in AU's transition. Every step toward the universal banking model—pursuing lower-cost deposits, prime corporate lending, and institutional accounts—presses AU's margins down toward incumbent levels. The investment thesis relies on funding costs falling faster than loan yields compress. Disclosed guidance provides no support for margin expansion; management explicitly indicated on its July 2026 earnings call that margins will not expand.13 Consequently, the bullish investment case depends entirely on volume expansion and operational efficiency rather than spread widening.
The activist's question
A critical evaluation of AU's trajectory highlights three unresolved concerns. First, the institution has repeatedly expanded into adjacent segments—such as credit cards and acquired microfinance—where it lacked proven underwriting capabilities, incurring credit losses in the process; whether universal banking represents a third instance of this pattern remains an open question. Second, operating expenses continue to expand faster than the balance sheet while primary efficiency reporting has shifted from cost-to-income to cost-to-assets. Third, the stock's valuation premium embeds execution assumptions that have not been demonstrated in prior strategic transitions.
These observations do not refute the bank's growth trajectory; rather, they identify key execution risks that remain unproven.
X. Bear vs Bull Case Analysis & Historical Falsification Stress Tests
The bull case
One: The funding cost thesis. If universal banking grants AU access to institutional and government deposits at rates closer to those paid by major private sector banks, the resulting margin expansion flows straight to net earnings. AU earned a net interest margin near 6% while paying a 6.48% cost of funds; securing lower-cost liabilities against the same asset yields represents a significant potential value unlock. This catalyst depends not on developing new lending capabilities, but on lowering liability costs.
Two: Secured lending anchors recovery. The recovery from fiscal year 2025 stress was driven by secured retail and commercial lending, which expanded 25% compared to 11% growth in unsecured loans, as annualized credit costs fell to 0.8% of average assets.3 Secured loans represented roughly 92% of total advances as of September 2025.4 Collateralized lending to borrowers dependent on their assets for income exhibits a distinct structural pattern: elevated reported delinquency during economic stress, followed by strong eventual recoveries—a dynamic demonstrated through both the COVID-19 pandemic and the recent microfinance downturn.
Three: High-barrier distribution network. AU has established 2,920 touchpoints across 21 states and four union territories, serving more than 1.25 crore customers while reducing single-state concentration in Rajasthan from 52% of advances to 26%.34 Physical trust infrastructure in semi-urban India requires substantial time and capital to construct, creating a physical presence that competitors cannot quickly replicate.
Four: Founder alignment and operational experience. Chief Executive Officer Sanjay Agarwal holds a 15.66% equity stake and was reappointed through April 2029, maintaining executive continuity after leading the institution through the 2008 global financial crisis, demonetization, the pandemic, and microfinance credit cycles.259
The bear case
One: Liability cost constraints. With the current and savings account (CASA) ratio at 29% and management indicating that borrowing costs have bottomed, the bank's benefit from monetary easing has largely run its course.313 If deposit competition intensifies, AU must either raise deposit rates—compressing net margins—or slow loan growth, given that an 80% credit-to-deposit ratio limits balance sheet flexibility.3
Two: Operating cost headwinds. The cost-to-income ratio reached 59.2% in the March 2026 quarter, exceeding levels from two years prior, as operating expenses grew 26% year-on-year against 23% loan growth.93 Management has targeted artificial intelligence deployment—budgeted at approximately ₹1,000 crore annually—to generate operational efficiency, though measurable cost leverage has yet to materialize.13
Three: Unsecured credit risk lingers. While projected microfinance credit costs of roughly 2.5%, including guarantee fees, mark a substantial improvement over the 5.4% peak, reliance on 96% CGFMU scheme coverage transfers downside risk to a government framework rather than demonstrating core underwriting improvement.133 Furthermore, credit cards and personal loans remained characterized by management on its July 2026 earnings call as a work in progress eighteen months into credit tightening.13
Four: Strategic middle-ground risks. The central operational risk is sacrificing high-yield asset spreads without achieving the balance sheet scale necessary to compete effectively for prime corporate business—a vulnerability reflected in CARE Ratings' characterization of AU's scale as moderate relative to established private sector peers.4
Five: Premium valuation context. A market capitalization of approximately ₹82,000 crore against ₹20,885 crore in equity capital and a mid-teens return on equity leaves limited room for execution error.2339 Market pricing reflects expectations of both cheaper funding via universal banking and operating leverage from technology investments, neither of which is fully established.
Historical falsification: three claims, tested
Claim one: AU maintains an all-weather asset quality moat.
The historical record highlights recurring cyclical vulnerability. Gross non-performing assets reached 4.25% in March 2021 with restructured loans at 1.8% of advances, exceeding the bank's 1.5% guidance.8 In fiscal year 2025, microfinance gross NPAs rose to 4.1% with annualized credit costs of 5.4%, while digital retail unsecured credit costs reached 9.2%.21 Overall gross NPAs rose to 2.41% by September 2025 from 1.98% a year earlier.4
Verdict: The claim is partially disproven. While AU's secured portfolio demonstrates strong ultimate recovery—gross NPAs fell back to 2.03% by March 2026—asset quality remains macro-sensitive, and unsecured exposures carry tail risks that have proven challenging to underwrite. The forward benchmark: Sustaining credit costs below 1.0% of average assets through a full economic cycle that includes sector stress. The FY26 credit cost of 0.96% represents a single data point during benign operating conditions.9
Claim two: AU executes accretive M&A.
The outcome of the Fincare merger complicates this thesis: return on assets diluted in fiscal year 2025, microfinance loan share was reduced from 7.3% to 5.0% within nine months, and the target's former chief executive departed nineteen months post-closing.419
Verdict: Immediate synergy claims are unsupported, while long-term gains remain unproven. AU acquired southern distribution at the cost of near-term credit losses and executive turnover. Although core system integration concluded in the March 2026 quarter,9 the decisive forward benchmark remains the proportion of total retail deposits sourced from southern states—the key metric determining whether the transaction secured a lasting deposit franchise.
Claim three: Technology drives measurable operating leverage.
Despite processing over 90% of transactions through digital channels, AU's cost-to-income ratio rose to 59.2% in the March 2026 quarter compared to 54.4% in the December 2024 quarter, showing limited structural efficiency gains across nine years of banking operations.9143
Verdict: Efficiency claims are not supported by empirical evidence to date. Digital platforms have expanded reach and service capacity rather than reducing unit operating costs. Management's AI initiatives represent a renewed effort to address cost structures, supported by initial headcount reductions recorded in May 2026.13 The forward benchmark: Sustaining a cost-to-income ratio below 55% or a cost-to-assets ratio below 4.0% without dampening balance sheet growth.
The risk radar, where it is actually material
Beyond broad macroeconomic factors, three specific structural risks impact AU's outlook.
Regulatory execution and approval timing represents the primary dependency. AU's strategic roadmap relies on central bank authorization, with final universal banking approval pending as of mid-2026.3 Regulatory delays or added conversion stipulations directly alter the funding cost timeline. Separately, microfinance remains subject to political and regulatory sensitivity in India, though AU's reduced portfolio share and 96% CGFMU coverage mitigate direct credit exposure.
Interest rate cycle sensitivity poses a secondary risk. Margin expansion in FY26 was supported by falling funding costs, which management noted have hit their floor.13 A shift toward higher interest rates would elevate liability costs immediately, while fixed-rate and semi-urban asset yields adjust over longer timeframes.
Concurrent transformation execution represents the key internal risk. Managing core acquisition integration, unsecured credit recovery, leadership transitions, regulatory conversion, and AI deployment simultaneously creates operational complexity where execution lapses can take quarters to surface.
Finally, CARE Ratings explicitly flags cybersecurity and customer data protection as key monitoring areas—a standard operational priority for a fast-growing digital retail franchise.4
The KPIs that matter
Three key operational metrics provide the clearest indicators of AU's structural trajectory.
CASA ratio. Standing at 29% in the June 2026 quarter, the CASA ratio serves as the primary measure of whether AU can establish a low-cost retail deposit base under a universal banking licence.3
Cost-to-income ratio. At 59.2% in the March 2026 quarter, this ratio evaluates whether technology spending—including ₹1,000 crore annually on AI—delivers operating leverage.9
Credit cost as a percentage of average assets. Reaching 0.96% for FY26 and 0.8% annualized in the June 2026 quarter, this metric provides the baseline test of asset quality discipline during shifts in portfolio mix.93
XI. Playbook: Business & Investing Lessons
Laddering the regulatory hierarchy. AU's defining strategic move was not a product choice or a geographical expansion—it was treating licenses as a strategic sequence. Moving from non-banking financial company to small finance bank and ultimately toward universal banking allowed each regulatory step to reduce the cost of capital supporting its asset generation. While most institutions view regulatory frameworks as constraints, AU approached the regulatory perimeter as a sequence of doors, spending three decades progressing through them. The broader lesson applies across regulated industries: an institution's license structure dictates its fundamental cost base more directly than operational efficiency, making a license upgrade potentially more valuable than internal cost optimizations. The corresponding caution is that each regulatory step carries mandatory trade-offs—the small finance bank framework imposed priority sector lending mandates and loan size caps that constrained AU's portfolio composition for eight years.
Concentric expansion, and where it fails. AU established its market position by dominating a high-yield niche within a single region before expanding outward. Strategic initiatives that remained close to its core underwriting capabilities—transitioning from vehicle finance to secured business loans, mortgages, and gold loans—proved effective. Attempts to leap beyond that core encountered operational friction. Credit cards required digital underwriting capabilities that AU lacked, while microfinance required group-lending credit discipline the bank had not previously managed, as executive management acknowledged in financial disclosures.21 The analytical takeaway is not to avoid expansion, but to evaluate strategic adjacency by underwriting capability rather than customer overlap. Although AU's credit card holders and commercial vehicle borrowers frequently belonged to the same demographic, assessing their credit risk required distinct operational models.
M&A into an unmanaged asset cycle. The Fincare transaction was announced in October 2023 and completed on April 1, 2024, immediately preceding a sector-wide deterioration in microfinance asset quality.1518 While timing an asset cycle precisely is difficult, the structural risk was clear: AU acquired an unsecured, uncollateralized portfolio at peak earnings using equity, subsequently requiring a strategic contraction from the asset class. For acquiring institutions, the practical principle is to size acquired unsecured exposure against potential loss rates at the trough of the credit cycle rather than earnings accretion at deal announcement. AU's eventual structural response—capping unsecured loans at approximately 10% of total advances and placing 96% of its microfinance portfolio under government credit guarantees—established appropriate risk boundaries, though only after absorbing credit stress.43
Phygital, properly understood. Emerging-market retail banking frequently frames physical branch networks as legacy overhead and mobile applications as the future. AU's operating model highlights a more precise distinction: branches attract deposits, while digital channels process transactions. Customers continue to seek physical presence for savings capital while utilizing digital platforms for transaction convenience. AU's video banking platform offered an effective middle path by delivering human interaction at digital delivery costs. However, the open question remains whether this hybrid model produces a lower cost structure than pure-play digital or traditional models, as nine years of elevated cost ratios have yet to demonstrate material operating leverage.
The dynamics of founder-led institutions. AU illustrates both the advantages and constraints of concentrated founder ownership. Chief Executive Officer Sanjay Agarwal's 15.66% equity stake aligns management incentives with long-term shareholder value, providing the authority to navigate cyclical downturns without short-term strategic pivots.25 Concurrently, concentrated leadership meant that major strategic initiatives—including the expansion into credit cards, the Fincare acquisition, and the universal banking conversion—were driven primarily by a single executive. Concentrated conviction enabled the systematic progression up the regulatory ladder, but it also resulted in credit card underwriting losses. Sound analysis requires factoring both outcomes into the institution's risk profile.
XII. Transcripts & Conference Call Guide for Analysts
AU is unusually detailed in its public disclosures, and its earnings calls reward examination in a specific sequence.
The January 24, 2025 call (Q3 FY25) is the most analytically valuable document the bank has published. It marks the moment where the merger thesis faced public scrutiny. In prepared remarks, management carefully segmented the portfolio, disclosing microfinance gross non-performing assets at 4.1%, a special mention account pool of 4.4%, and an annualized credit cost of 5.4%, alongside a 9.2% credit cost on credit cards and personal loans.21 The question-and-answer session revealed the underlying operational pressure. Analyst Kunal Shah of Citi inquired where the bank stood in its microfinance and credit card cycles and whether card credit costs exceeding 10% would persist; Sanjay Agarwal confirmed they would.21 Madhuchanda Dey of MCPro raised the broader strategic question of whether AU would retreat to its traditional lending core, prompting management's clearest admission of cyclical stress. Management described the stress as driven by borrower over-leverage rather than an isolated event risk, acknowledging, "we might have made some mistake." Management also reaffirmed a 10% cap on unsecured exposure, noting that the limit had been established at the time of acquisition.21 For analysts evaluating management credibility, this transcript establishes the benchmark against which subsequent performance must be measured.
The April 2025 and April 2026 results calls track the recovery. Analyzing these transcripts highlights the evolution of management guidance against reported outcomes. On the January 2025 call, full-year FY25 credit costs were guided to between 1.55% and 1.60%; actual FY25 credit costs came in lower at 1.30% of average assets, before improving further to 0.96% in FY26.219 Disclosures from this period also highlight a shift in management's primary efficiency narrative, with cost-to-assets displacing the cost-to-income ratio as the primary reported metric.9
The July 25, 2026 call (Q1 FY27) provides the bank's current operational outlook, presenting a more restrained narrative than its marketing releases. Three core takeaways emerge from the discussion. First, management declined to issue net interest margin guidance, noting that margins involve multiple moving variables and that borrowing costs have effectively bottomed out.13 Second, management targeted a return on assets of roughly 1.8%, specifying that profitability gains would stem from operating expense efficiency and credit cost normalization rather than margin expansion.13 Third, management quantified its artificial intelligence investments at approximately ₹1,000 crore annually—representing 12% to 13% of operating expenses—citing an initial headcount reduction in May 2026 as early evidence of efficiency gains.13 Additionally, management guided microfinance credit costs to around 2.5% including guarantee fees—below its prior 3% estimate—while framing credit cards and personal loans as work in progress.13
Regulatory disclosures surrounding the universal banking licence. The press release issued on August 7, 2025, announcing in-principle approval, alongside the holding-company modification disclosed with the FY26 results in April 2026, outline the bank's conversion trajectory.19 These filings define clear operational boundaries: the in-principle approval carries an 18-month validity window, AU submitted its final application in March 2026, and final regulatory authorization remained pending through the Q1 FY27 reporting period.193
The central analytical question for coming quarters is precise: while AU has secured regulatory permission to transition into a universal bank, it must now demonstrate that it can attract low-cost capital at scale. The historical record shows an institution capable of underwriting underserved borrowers, recovering from credit downturns, and expanding its balance sheet, even as tech-driven operating leverage remains unproven. What remains undemonstrated is whether AU can lower its deposit costs to match established universal banking incumbents. That evidence will appear first in a single balance sheet metric—the current and savings account (CASA) ratio—long before it is reflected in corporate narratives.
References
-
AU Small Finance Bank Makes History: Receives in-principle approval from the RBI to become a Universal Bank — AU Small Finance Bank, 2025-08-07 ↩↩↩↩↩↩↩
-
RBI grants small finance banks licence to 10 entities — Business Standard, 2015-09-16 ↩↩
-
AU Small Finance Bank Announces Q1'FY27 Financial Results — AU Small Finance Bank, 2026-07-25 ↩↩↩↩↩↩↩↩↩↩↩↩↩↩↩↩↩↩↩↩↩↩↩↩↩↩↩↩↩↩↩↩↩↩↩↩↩↩↩
-
Rating Press Release: AU Small Finance Bank Limited — CARE Ratings, 2025-12-01 ↩↩↩↩↩↩↩↩↩↩↩↩↩↩↩↩↩↩↩↩↩↩↩
-
Warburg Pincus invests in Au Financiers — Business Standard, 2012-03-13 ↩
-
IFC, Warburg, ChrysCap pump in $21 mn more into Au Financiers — Business Standard, 2014-04-16 ↩
-
Kedaara Capital invests in Au Financiers — Business Standard, 2014-12-24 ↩
-
Asset quality, second Covid wave concerns weigh on AU Small Fin Bank stock — Business Standard, 2021-04-30 ↩↩
-
AU Small Finance Bank Announces Q4'FY26/FY26 Financial Results — AU Small Finance Bank, 2026-04-27 ↩↩↩↩↩↩↩↩↩↩↩↩↩↩↩↩↩↩↩↩↩↩↩↩↩↩↩↩↩↩↩↩↩
-
AU Small Finance Bank fixes IPO price band at Rs 355-358/share — Business Standard, 2017-06-19 ↩
-
AU Small Finance Bank makes strong debut, lists at 47% premium to IPO price — Business Standard, 2017-07-10 ↩
-
Warburg Pincus, Kedaara Capital, ChrysCapital, Motilal Oswal Private Equity & IFC Sell Stakes — Global Private Capital Association ↩
-
AU Small Finance Bank Q1 FY27 slides: 37% profit growth, AI push — Investing.com, 2026-07-25 ↩↩↩↩↩↩↩↩↩↩↩↩↩↩↩↩↩↩↩
-
AU Small Finance Bank Q3FY25 results: Profit surges 41% to Rs 528 crore — Business Standard, 2025-01-24 ↩↩
-
Fincare SFB to merge with AU Small Finance Bank in all-share deal — Business Standard, 2023-10-29 ↩↩
-
AU Small Finance Bank and Fincare Small Finance Bank merge, reshaping the Indian banking landscape — AU Small Finance Bank, 2024 ↩
-
AU SFB shares in focus as Fincare Small Finance Bank to merge with lender — Business Today, 2023-10-30 ↩
-
Fincare Small Finance Bank merger with AU SFB gets RBI approval — Business Standard, 2024-03-04 ↩↩
-
AU Small Finance Bank Deputy CEO Rajeev Yadav resigns effective October 31 — People Matters, 2025-11-03 ↩↩↩↩
-
AU Small Finance Bank to double balance sheet to Rs 2.5 trn in 3 yrs: MD — Business Standard, 2024-04-28 ↩↩
-
AU Small Finance Bank Q3 FY25 Earnings Conference Call Transcript — AU Small Finance Bank, 2025-01-24 ↩↩↩↩↩↩↩↩↩↩↩↩↩↩↩↩↩
-
Rajeev Yadav Appointed as MD & CEO at Celestia Money — HR Today, 2026-04 ↩
-
AU Small Finance Bank Ltd share price and key insights — Screener.in, 2026 ↩↩
-
RBI removes NOFHC requirement for AU SFB's transition to Universal Bank — Business Standard, 2026-03-07 ↩
-
Shareholding Pattern, AU Small Finance Bank Limited — AU Small Finance Bank, 2026-03-31 ↩↩↩
 LinkedIn
 WhatsApp
 Reddit
 Hacker News
 Email
Email Kindle
 RSS Feed
 Spotify
 Apple Podcasts
 Amazon Music
 Audible
 YouTube